Showing posts with label Baseball playoffs. Show all posts

Thursday, October 17, 2013

Yoo Hee-kwan Scouting Report

Yoo Hee-kwan (or Yu Heui-Kwan) was one of the KBO pitchers that statistically rated out as a possible MLB prospect, at least going by 2013's statistics. Yoo threw 145.1 innings in 2013, posting a 3.53 ERA and 3.58 FIP. This had to be one of the biggest surprises of the Korea Baseball Organization season, as he had just 16 innings under his belt in the KBO before the year started, and hadn't pitched with Doosan since 2010. Yoo also made two starts in the first round of the playoffs against the Nexen Heroes, striking out nearly a guy an inning, and giving up just 1 run. The 27 year old left-hander burst on to the scene rather suddenly, so he doesn't have a Naver scouting report. Standing under 6 feet, Yoo isn't the prototypical starting pitcher, which may be one of the reasons he was a late bloomer. As we will see below, he also isn't a traditional power pitcher.

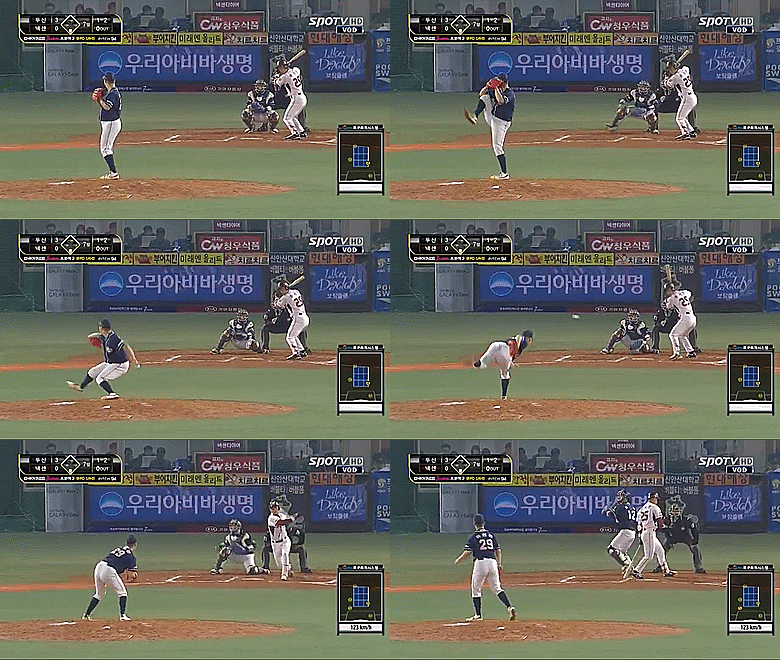
First, however, let's take a look at his mechanics, starting with a side view

He brings a high leg kick, with a slight hip turn before coming forward, keeping his hands high. It doesn't appear to be what you would consider an extremely deceptive delivery, but it is clearly one that works for him. He threw low with great frequency, so it seems that he gets on top of the ball very well despite the size.

The following GIF is Yoo throwing a fastball by the best hitter in the KBO, Park Byung-ho

The first thing you notice is the velocity. The pitch is only about 82.46 MPH. In his two playoff starts, Yoo maxed out at just short of 84 MPH and averaged about 81.5 MPH.

He would pitch inside to right-handers at times despite the velocity, and as you can see above, was effective at doing so. Many times to left-handers he was trying to get the fastball outside and would basically fall off the mound, overcompensating to get the ball glove side.

Slider:

According to the way I classified his pitches, the slider averaged just above 74 MPH. It is pretty sweepy when it is going well, getting to the opposite side of the plate rather consistently. However, sometimes he would throw something gloveside that wasn't as sweepy, slowing it down to 71 MPH at times. Many times these pitches hung towards the middle of the plate, so there is a chance they were just badly thrown sliders. He did throw it to righties very rarely, going low and in, and mostly doing so effectively.

Change:

Averaging about 75 MPH, the pitch was extremely arm side heavy and his best and most frequent secondary pitch. It occasionally had good downward movement. While he almost always did a good job of keeping it low, there did appear to be two different movements on the change, as he would bury it sometimes, and other times he kept it up for a strike. Both of these looked to be by design. When he wasn't getting whiffs with the change, he was still getting grounders. It seemed to be most effective when he would throw fastballs low and away, and then follow with the change in a similar spot, causing major problems in the hitter's timing.

The change and the slider sometimes tended to blend, at about 74-75 MPH it would go inside and low to right-handed batters, sometimes looking like a weird 2-seamer.

Curve:

This was the least frequent out of his four main pitches (assuming the variations aren't different pitches), and of course the slowest, averaging about 66 MPH. It didn't always have great depth consistently and he had a tendency to hang it, but he could fool a left-handed batter with it every once in a while.

Obviously the fastball velocity alone limits him from being a MLB prospect, and it helps explain why it took this long for him to get his first chance in the KBO, but with that said, there is a good mix of pitches and deception here, enough that he should be effective in the KBO in coming years. Yoo probably won't continue to pitch at the same level as he did in 2013 as hitters begin to have more opportunities to adjust to him, but he should still be an above average starter in the league just because of his pitchability. 

Wednesday, November 28, 2012

Mike Leake Scouting Report

With reports of the Reds re-signing Jonathan Broxton, reporter John Fay believes that it will be easy for the Reds to move Mike Leake, as this most likely signals that Aroldis Chapman is finally moving to the rotation. Fay believes that Leake still has decent trade value despite having a rough season.

When you actually look at Mike Leake's advanced metrics, he was really no different in 2012:

2010: 115 FIP -, 104 xFIP -, 4.33 SIERA

2011: 108 FIP -, 95 xFIP, 3.76 SIERA

2012: 111 FIP -, 98 xFIP, 4.01 SIERA

Along with his career ERA - of 106, it appears that Leake is a slightly below average starter. It does seem, if his xFIP and SIERA are any indications, that he has some pretty major home run issues and would benefit from a more pitcher friendly park. The Reds' park has a 107 park factor over the last 3 years, and Leake has a career 1.26 HR/9IP and 14.6 HR/FB %, certainly supporting that point. Since the HR/FB % spiked in 2012, it made his ERA worse and got him left off of the playoff roster. When Johnny Cueto injured himself in the first start of the post-season, Leake was added to the roster and started game 4. At the Great American Ballpark against the Giants, the start didn't go well, as Leake gave up a homer on the 2nd pitch of the game and gave up 5 runs in 4.1 innings, striking out just one and walking 2 (2 homers in all).

Leake was drafted 10th overall by the Reds in 2009 out of Arizona State as an advanced pitcher that didn't have a high ceiling, but didn't need to pitch in the minors either (making his MLB debut before his MiLB debut, and pitching in just 2 MiLB games so far). The 25 year old right-hander's stuff is certainly below average, with an average fastball under 90 MPH, using more cutters and sinkers than 4-seam fastballs. It seems that he is relying less and less on his slider that averages a little more than 81 MPH (dropping from nearly 18% usage to 8-9% usage in 2012), along with a change and a (not slow) curve. In going back and reading old scouting reports, it seems that it was unclear as to what was his best pitch. His sinker is really similar in velocity to pitchers like David Pauley, Wandy Rodriguez, and Ian Kennedy. The horizontal movement on it is similar to those like Cliff Lee, Jarrod Washburn, and Ryan Vogelsong. Vertically, his sinker breaks a lot like the sinkers of Roy Halladay and Jerome Williams. His cutter breaks horizontally like former teammate's Travis Wood and the Houston Astros' Lucas Harrell. Vertically, it is like Matt Harrison's and Chris Carpenter's. These are some pretty good names. The curve breaks like the curves of Stephen Strasburg and A.J. Griffin (two curves I like) horizontally, and Anibal Sanchez, Brandon McCarthy, and Paul Maholm vertically. The slider's horizontal movement is similar to Zach Greinke and Jake Arrieta and vertically like Ricky Nolasco, Brandon Beachy, and Johnny Cueto. His change is also similar to Beachy horizontally, as well as Gil Meche and John Danks. Vertically, it is like Barry Zito's and Roy Oswalt's.

Just from times I have seen him, it seems that his sinker occasionally drifts up and that is why he gives up so many homers. The lack of stuff makes the occasional mistake more costly. When he throws it down and away at the bottom of the strikezone against righties, it is a really nice pitch. However, when it gets up, it is straight and pretty hittable. Because of his stuff and lack of a real 4-seamer, he really can't live high in the zone, though he sometimes does (ineffectively), which limits his ability to move the hitters eyes and makes him less dangerous when it comes to missing bats (which is one of the reasons that his strikeout totals are so low). The closest he comes to throwing a pitch high is when he throws his cutter (to right-handed hitters especially) in the somewhat middle of the plate (height-wise, it usually stays off the plate, and even though the velocity is usually a little lower, it seems like a less hittable pitch). It seems that he would rather go away from both lefties and righties, not wanting to go inside.
The slider is somewhat of a frisbee slider, almost knuckling with some pretty soft (but dramatic and sweeping) break to the left-handed batters box (it is so soft that Pitch F/X often confuses it for the curves when it dips to 80 MPH or lower). His curveball is a pretty hard curveball that drops quickly without big loop.

There is a little evidence from his overall release point chart that he has raised his release point slightly since coming into the Majors, but from looking at a bunch of individual game date, it seems he has actually just been more consistent (something you would expect to see as a pitcher matures and develops. An alternative explanation would be, something I saw in at least one report, that he used to occasionally drop his arm angle, whether unintentional or intentional. He could simply no longer be doing this, which would make the release point data pretty noisy). Because he is "just" 6 foot tall, he doesn't quite get the downward plane that most pitchers do (although he releases the ball higher than Johnny Cueto) because he lets go of the ball below 6 feet high.


Known for his pitchability, Leake doesn't discriminate when it comes to who he throws his cutter to, and still throws his change to righties about 6% of the time (just short of half the time he throws it to lefties). If he has a pitch he really likes to go to for a strikeout, it is the slider against both lefties and righties. Interestingly, he throws the curve more against lefties than he does against righties. It is the only pitch that he throws for strikes less than 60 % of the time, with the cutter being the pitch he throws for strikes the most (perhaps the reason that there isn't much variation when he throws it, throwing it somewhere around 20-24% of the time regardless of the situation). The slider, which makes sense considering that he throws it so much two strikes, is the only pitch he gets many whiffs with. He gives up more contact than league average and gets far less swings and misses than average. So his game has to be weak pop-ups (it isn't) or ground-balls (48.9 GB % in his career, very solid). This is why he throws so many sinkers and cutters (his slider also gets a lot of ground-balls). These pitches have also helped him have basically no platoon splits, about equally effective against both lefties and righties.

So far, Leake has not reached 200 innings in a season, setting a career high in 2012 with a 179. To be a valuable mid-rotation starter, one needs to be a good innings eater, something Leake has not been so far. He was put on the DL in 2010 thanks to shoulder fatigue, but I am not convinced that is something to be concerned about. It also doesn't look he wears down a the end of the year, at least as far as effectiveness goes. At his age, I think his new team has to let him really eat up innings in 2013. As mentioned above, the hitter friendly Great American Ballpark has really hurt Leake, as he has an ERA of almost a full run higher at home in his career. One of the less friendly home run parks would make Leake a significantly better pitcher. Especially if the team has a good infield (which would seem to be what he had with the Reds) that would turn a lot of Leake's ground-balls into outs. I think he can be a guy in the middle of the rotation and pitch at a league average rate with a new team. He is first year arbitration eligible this off-season, and according to MLB Trade Rumors, he is projected to make 2.9 million for 2013 (not to mention two more years of control after that). That is a bargain for a middle of the rotation pitcher, especially considering what Scott Feldman got (6 million), an injured Scott Baker (5.5 million) got, and especially what Jeremy Guthrie got (3 guaranteed years for 20 million. This doesn't mention that Bartolo Colon got 3 million and he is coming off a suspension and is 39). I think Leake has quite a bit of trade value (even if he is a slightly below average pitcher because of his lack of stuff) and the Reds should get a good package for him.

Friday, September 7, 2012

A Few Yankees-Phillies Minor League Notes

The Trenton Thunder and Reading Phillies played in the AA playoffs, and on I watched the Friday September 7th game on MiLB.TV and wrote a few notes on a few of the players I hadn't written about this year.

Zoilo Almonte is a left-handed hitter with good size. He is having a pretty big power year, but he doesn't have the most desirable swing. Almonte was definitely looking to go the other way. He chased breaking balls way out of the zone and had serious contact issues (which isn't surprising considering the K/BB he has put up this year)

Addison Maruszak is a right-handed hitting shortstop fooled by changeup. I thought he had a GB-looking swing, but that really hasn't played that much in the minors. In fact this year, he has a nice 4.8 HR/Contact %, and decent ISO of .182. He was fooled by a curveball that was way out of the zone, but his K/BB has been solid over the past couple of years. The big concern is age, as he is slightly old for the level.

Tyler Austin played 1st base and handled it pretty well. He looks like a first baseman or a slow corner outfielder in size. His bat has been one of the big stories in the Yankees system. The problem is that he has spent so little time at each stop that it is hard to evaluate his numbers at each level. He has a pretty looking swing, as it is really effortless looking and still provides him with plenty of power. He has good speed scores throughout his stops so far (for what that is worth) and at least has average looking speed currently.

Mikey O'Brien at 5-11 is probably too short for a starting pitcher that throws 200 innings. He has a straight fastball with decent looking velocity. He was able  to give it some movement later in the outing and the straight fastball pretty much disappeared. O'Brien can throw the curveball for strikes but not all of them were quality and he didn't show the ability to keep it down. With that said, he threw several really nice ones. He threw a couple of changeups but it wasn't a pitch he much feel or (apparently) much confidence in it. He lost his release point for a while, but threw a lot of good pitches that barely caught the corner. He mainly worked inside to righties and away from lefties. He left a couple of pitches up that hurt him. Perhaps it is confirmation bias, but short pitchers usually have a hard time getting on top of the ball and keeping it down. His GB% is below average for the league (but he has also been slightly below average according to both FIP and SIERA in his 103 AA innings this year). He has actually done a good job keeping the ball in the park, but he really isn't missing many bats.

Phillies:

Troy Hanzawa is old for the league and has yet to show anything with the bat since being drafted out of college in '08, but he is a good looking defense shortstop. You would like to see him steal some bases, which he hasn't done. This makes him a very one dimensional player. He looks very susceptible to the inside fastball. The bat speed just isn't there.

2B Tug Hulett is a left-handed hitter with solid bat speed and good patience. He has only hit about league average this year according to OPS, but his LD/GB/FB is really good. He is 2 years older than Hanzawa and was with the Nationals organization last year. He is the kind of guy that is usually in AAA, but the Phillies must have an organization need in AA at 2B. It looks like he has the range to play at least a decent 2nd base, but the arm looks pretty weak (which keeps him at 2nd as opposed to a shot at 3rd or SS). He also is not real speedy and is short but stout looking. I am sure he will get a job in the off-season with a club to play in AAA and serve as an emergency 2nd base option in the organization.

Tyson Gillies is fast and this makes him ideal for centerfield, even if his jumps aren't very good. His arm wasn't very impressive though. He had problems chasing pitches way out of the zone. This has always been a problem and he is walking under 6% of the time this year. He is hitting well above league average this year in 67 games (around .100 OPS points), but he also has a big BABIP. While the speed will probably give him a high career BABIP, it is doubtful he can keep it above .350 (just because it is hard to count on someone consistently doing that). He is making plenty of contact and hitting plenty of line drives, so there is definitely some hope that he can hit enough to make it to the Majors and contribute. He is just going to be a decent average guy with a low OBP. If his defensive skills continue to improve, this will be an acceptable package.

Thursday, October 20, 2011

The Koji trade, and deciphering what exactly happened to Uehara in Texas

Uehara roughly means "great control" in Japanese. For Orioles fans, this is extremely appropriate, for Ranger fans, Koji Uehara has struggled with just that. The reliever that was aquired at the trade deadline was left on the Texas Ranger's World Series roster after a mediocre last two months of the year and a horrible postseason. While he had a 2 WAR (awesome for a reliever) with the Orioles in 2011, he had just a .2 WAR with Texas (would be a .6 WAR if extended into a whole season). The Rangers traded for Uehara by shipping off two Major League players to Baltimore, Tommy Hunter and Chris Davis (Davis was technically in the minors at the time of the trade but has been in the majors for most of the last few seasons). Chris Davis was pretty pathetic with the Orioles with a -.5 WAR, while Tommy Hunter had a .6 WAR, adding up to a .1 WAR for the Orioles. This means that the Rangers barely won the trade down the stretch, but all 3 players are under contract for next season, so we will have to come back to this trade in the future. The Rangers had to pay 1 million of Koji's contract for this year, while Hunter and Davis made less than that combined. So the Rangers got slightly more production, while the Orioles got much better value. So what happened to Koji? In Baltimore he racked up an incredible -7.94 PE, while in Texas his PE was still really awesome at -6.529. In both places, he has struck out more than 11 per 9 innings. In Baltimore, his TR was the highest I have ever seen at almost 20! However, there were some things that probably should have caught the Rangers' eyes. In Baltimore, he averaged more than one homer per 9 innings, a little high. In Texas, that exploded to 2.5 HR/9IP. He is not the first pitcher to go to Texas and struggle with the longball. What should have been concerning, and I find it hard that Jon Daniels and company would have missed this, is that he is a flyball pitcher. It has been well documented that starter Colby Lewis, being a flyball pitcher, has an ERA of more than 2 higher at home. So why would the Rangers trade for a reliever that gave up 2 flyballs to every groundball in Baltimore? This doesn't mention that Uehara's great ERA was kind of fluky, with a FIP of about 1 higher than his ERA (still would be really good). We will see in the future if Uehara is able to adjust to the hitter friendly park that is the Ballpark in Arlington.

Tuesday, October 18, 2011

Are the Tigers making the same mistake as the Twins at catcher?

During the ALCS we heard all about the toll a season took on a catcher as we watched Alex Avila limp around and be totally ineffective. We also witnessed the absolute destruction of one of the games most talented, Joe Mauer, in the 2011 season. Outside of a linemen in football, it is hard to find a more strenuous and demanding position that catcher. Many teams start their best one 3 games and their backup 2 games in a row. It isn't hard to see why Mauer fell apart, look at his stats from 2005 (his first full year) on:
2005: 131 G 554 PA 3.4 WAR
06: 140 605 7
07: 109 471 4.6
08: 146 633 8.7
09: 138 606 7.9
10: 137 584 5.9
11: 82 333 1.7

Compare to Alex Avila:
10: 104 353 .2
11: 141 551 5.4

Joe Mauer now suffers from a rare kind of leg weakness and the best days of his career are already sadly behind him. The numbers above clearly show that they just rode him too much. The Tigers of all teams, division rivals of the Twins, should know not to kill their catcher like that. If Mauer is any indication, they can ride him like this for about 2 years, but then its over. Surely the front office will step in and not let this happen.

World Series Preview: Rangers and Cardinals

So its time for the World Series. Here is the statistical preview:

The Rangers are going to look like this in the starting rotation: Wilson (.148 WAR per start, -1.87 PE), Lewis (.061 WAR per start, .51 PE), Harrison (.13 WAR per Start, 1.17 PE), Holland (.55 PE, .081 WAR per Start),  as starting pitchers. Their  bullpen looks like this Ogando (3.4 WAR, .3 PE), Feliz (-1.8 PE, .8 WAR), Gonzalez (-.55 PE, .2 WAR) , Adams (-5.24 PE, 1.7 WAR), Uejara (1.2 WAR, -7.09 PE), Oliver (-2.01 PE, 1.2 WAR), Lowe (.3 WAR and -.56 PE) and Feldman (.98 PE, .2 WAR). Their lineup will probably look like (in no particular order): Hamilton (.03 WAR per game, 1.723 PPG, 2.42 PAPP), Cruz (.011 WAR per Game, 1.52 PPG, 2.74 PAPP), Murphy (2.74 PAPP, .966 PPG, Negative WAR), Napoli (2.13 PAPP, .045 WAR per game, 1.504 PPG), Kinsler (2.39 PAPP, 1.67 PPG, .035 WAR per Game), Andrus (.024 WAR per game, 1.32 PPG, 2.68 PAPP) Beltre (1.76 PPG, .043 WAR per game, 2.63 PAPP), Young (.015 WAR per game, 2.5 PAPP, 1.33 PPG), and with the DH Torreabla (.006 WAR per game, .75 PPG, 3.14 PAPP).

 For the Cardinals, the starting rotation should look like: Carpenter (.11 WAR per Start, .07 PE), Lohse (.083 WAR per start, 1.66 PE), Garcia (.028 WAR per start, .34 PE), and Jackson (1.38 PE, .067 WAR).  Their bullpen maps out with these guys: Rhodes (2.95 PE, -.6 WAR), Rzepczynski (1 WAR, -2.07 PE), Dotel (-4.04 PE, .9 WAR), , Salas (-3.93 PE, 1 WAR), Westbrook (3.91 PE, Negative WAR), Mclellen (3.23 PE, negative WAR), Motte (-3.15 PE, 1.6 WAR), and Boggs (.3 WAR, .43 PE). They will probably run out this lineup (in no order): Jay (.01 WAR per game, 2.92 PAPP, .63 PPG), Berkman (.036 WAR per game, 1.5 PPG, 2.21 PAPP) , Holliday (.033 WAR per game, 1.48 PPG, 2.4 PAPP), Pujols (.037 WAR per game, 2.33 PAPP, 1.7 PPG), Freese (1.1 PPG, .019 WAR per game, 2.71 PAPP), Furcal (.028 WAR per game, 2.855 PAPP, 1.12 PPG), Schumaker (.005 WAR per game, 3.05 PAPP, .63 PPG), Molina (2.71 PAPP, .99 PPG, .028 WAR per game), and when DH Craig (2.33 PAPP, 1.19 PPG, and .039 WAR per game).

As far as starting pitching goes, The Rangers have advantage in game 1 (and in turn, gave 5), and in games 2 and 6 it is a split as Lewis has a better PE, while Lohse has a better WAR. Basically the same happens in game 3 and 7 between Harrison and Garcia. In game 4, Holland is better than Edwin Jackson, so the Rangers have the clear advantage in starting pitching. The Rangers bullpen has a much better WAR, and a much better than PE. It is not even close, the Rangers have the better bullpen. With or without the DH, the Cardinals have the better lineup according to WAR, but the Rangers have the better Production Per Game (with or without the DH). The Cardinals also have the higher Plate Appearances per Positive Play, which is bad, you want the lower number. Something similar happened in the Tampa Bay and Ranger series, as the Rangers were better at PPG and PAPP but worse at WAR. This is most likely because of defense. So the Rangers have the better offense and pitching. The Cardinals are only better at defense. So the statistics show a clear advantage for the Rangers in this series.

Monday, October 17, 2011

Free Agent Watch: Ramon Santiago

Ramon Santiago put up 1.3 WAR in 2011. That would be worth 3.9 million according to Halladay Standard. Over the past 3 years, he has averaged a 1.67 WAR, worth 5 million according to Halladay Standard. It is clearly his defense that is carrying him though, he had a pathetic 3.3 PAPP, .63 PPG, .311 OBP, .695 OPS in 2011. In his career, the numbers are about the same: 3.3 PAPP, .67, .316 OBP, .658 OPS. He has a career 81.96 pitches per starter (a metric that measures how many pitches he would cause a starter to throw through 6 innings if he was every single plate appearance), hits more groundballs than major league average, and 17% of his flyballs were in the infield in 2011 (way more than league average). Of course, he doesn't walk much, gets less extra base hits than most major leaguers, and has over twice as many at-bats per home runs as average. His career secondary average is a pretty putrid .176, and an offense full of Santiago's would win just 38% of its games (assuming average pitching and fielding). Whatever he is going to be paid, it is going to be too much. The only positive statistic he has every led the league in is sacrifice hits. That says it all.

Free Agent Watch: K-Rod

Francisco Rodriquez registered a 2.4 WAR in 2011, which is worth 7.2 million according to Halladay Standard. Bullpen pitchers have proved to be pretty expendable and vastly overpaid, as the Rays proved this year. 1.57 WAR average over the past 3 years. Worth about 4.7 million. In 2011 he had a PE of -3.58. In his career he has a -5.54. In 2011, he had a very nice TR of 13.11, as his career TR is 11.89. So in 2011, with the Brewers and Mets, he was more efficient, even though his results weren't quite as good. This would probably be good for his prospective teams, and if it were a different name, it might create a market inefficiency and K-Rod could worth more than he is paid. However, he is a big name pitcher, and has Scott Boras as an agent, meaning that won't happen. He actually had an extremely high BABIP in 2011 (.321) compared to his career (.275). It is tempting to argue that he was unlucky in 2011, but that is not what FIP suggests, as his ERA and FIP are almost identical. The big thing, and that is why the PE isn't as low as it usually is for Rodriguez, is that he struck out less batters. Striking out more than a hitter an inning is nothing to sneeze at, but it is not as good as his career K/9IP of over 11. He did give up slightly less home runs, and home runs do not show up on BABIP. This could explain the difference in BABIP. In the end, he will be a highly paid, controversial reliever. He has had off the field issues and "team" issues, and it is difficult to calculate what they means or affects their worth. For example, the one mistake the Tampa Bay Rays made previous to the 2011 season was sign Manny Ramirez. That proved to be a disaster and a waste of money. Their are a few other examples you can think of as well, such as the Cubs giving all that money to Carlos Zambrano. I wouldn't take the bait on K-Rod, but it has more to do with relievers being overvalued that the off the field issues.

Friday, October 14, 2011

Pitches Against Starter Metric

It is common baseball wisdom that the earlier you get a starter out of the game, the better chance you have to win. So here I will try to establish a metric that shows how good a team or player is at accomplishing this feat. A team needs to get at least 6.67 pitches per out to get the bullpen after 6 innings (assuming the starter goes 120 pitches). So of course we have to factor pitches per plate appearance, but we also have to factor OBP. Usually the relief pitchers are not as good as the starters, except the set up man and closers for most good teams. So the goal would be to not let the starter go more than 6 innings. You can use this metric to grade players by seeing how many pitches it takes them to get out 18 times. For example, for Robinson Cano, you take his .349 OBP and multiply it by 18. This gives you 6.282, meaning in 18 plate appearances, he will reach 6.282 times. So you add that to 18 to get 24.282. Then multiply it by his pitches per plate appearance (3.34 for Cano). This is only 81.1, meaning it would only take a starting pitcher 81 pitches to get through 6 innings of a Cano only lineup (and the pitcher would clearly still be in the game). Matt Kemp would cause a pitcher to be at 99 pitches through 6 innings. This is also a way to judge the quality of lineups. For example, the Brewers lineup in game 4 of the ALCS Morgan (.357 OBP, 3.69 Pit/PA), Kotsay (.329 OBP, 3.58 Pit/PA), Braun (.397 OBP, 3.93 Pit/PA), Fielder (.415, 3.79), Weeks (.350, 3.84), Hairston (.348, 3.86), Betancourt (.271, 3.16), Kottaras (.311, 3.81), and Wolf (.177, 3.56). This gives you a 2.955 OBP and 33.22 pitches. Because it is 18 outs, multiply both numbers to get 66.44 pitches and 5.91 OBP. Because the OBP is 5.91 you multiply that by the average Pit/PA for the 9 batters (3.69) to get about 21.81. Add that number to the 66.44 pitches to get 88.25 pitches as the final number through 6 innings. So the Brewers lineup is better that Robinson Cano but not as good as Matt Kemp, according to this metric. This pitches against starter metric I really like and will keep using.

How Real is James Shields

James Shields was one of the worst full time starting pitchers in MLB in 2010 (a 5.18 ERA was among the worst). In 2011, he was one of the best. So who is he? In 2010, he had a very pedestrian 1.28 PE, while in 2011 he had a great -2.11 PE. His WAR in 2011 was 6.1, while his terrible 2010 season registered a -1.3 WAR. In 2011, he had a great 12.28 TR. In 2010 his TR was 9, which frankly isn't terrible. Shields' groundball percentage was only slightly lower, and HR/FB was only slightly higher in 2010. His FIP in 2010 was 4.24, which would have been a not too bad ERA. In 2011, his FIP was actually higher than his ERA, so while his fielders made him look worse in 2010, they made him look better in 2011. The BABIP difference was also striking as well. In 2010 it was .341! In 2010 it was .258. He also gave up more infield hits in 2010. He actually struck out more and walked less in 2010. The only things that really go against the Shields was unlucky narrative in 2010 and due for a good year in 2011, was that he gave up more line drives and fly balls in 2010. Looking at his pitch selection, he threw less fastballs and more curveballs in 2011, and that can't be emphasized enough. Other than that, the metrics seem to argue that Shields is somewhere in between his terrible 2010 year and his amazing 2011 season. Expecting a WAR of around 4 next year would probably be a good expectation.

There have been many rumors that Shields will be traded. Should he be traded? Of course it matters what you are getting back. He is going to make about $7 million in 2012, and if he does put up a 4 WAR next year, that is a WASP of 1750, very very solid. However, one has to grapple with the money problems of the Rays. At about a $42 million payroll, Shields would be 1/6th of the team's salary. They would obviously need more than 4 wins over replacement for 1/6th of their salary to make the playoffs. Assuming they need 95 wins to make the playoffs, they would need over 7 WAR for every 1/6th of their payroll. So it seems to make sense for the Rays to trade him, but they better get a very good package.

Saturday, October 8, 2011

Playoff Preview: Brewers and Cardinals

I really have thought that the Brewers were the best team in the National League outside of the newly eliminated Phillies, and they have a complete team (outside of holes in their fielding), so I will go with them before statistics.

For the Cardinals, the starting rotation should look like: Carpenter (.11 WAR per Start, .07 PE), Lohse (.083 WAR per start, 1.66 PE), Garcia (.028 WAR per start, .34 PE), and Westbrook (3.91 PE, Negative WAR).  Their bullpen maps out with these guys: Rhodes (2.95 PE, -.6 WAR), Rzepczynski (1 WAR, -2.07 PE), Dotel (-4.04 PE, .9 WAR), Jackson (1.38 PE, 3.8 WAR), Salas (-3.93 PE, 1 WAR), Mclellen (3.23 PE, negative WAR), Motte (-3.15 PE, 1.6 WAR), and Boggs (.3 WAR, .43 PE). They will probably run out this lineup (in no order): Jay (.01 WAR per game, 2.92 PAPP, .63 PPG), Berkman (.036 WAR per game, 1.5 PPG, 2.21 PAPP) , Holliday (.033 WAR per game, 1.48 PPG, 2.4 PAPP), Pujols (.037 WAR per game, 2.33 PAPP, 1.7 PPG), Freese (1.1 PPG, .019 WAR per game, 2.71 PAPP), Furcal (.028 WAR per game, 2.855 PAPP, 1.12 PPG), Schumaker (.005 WAR per game, 3.05 PAPP, .63 PPG), and Molina (2.71 PAPP, .99 PPG, .028 WAR per game).

I expect the Brewers to use Gallardo (.08 WAR a start, -1.85 PE), Grienke (-3.21 PE, .056 WAR per start), Marcum (-.11 PE, .1 WAR a start), and Wolf (1.78 PE, .1 WAR a star) as the starting pitchers. Their bullpen will probably include Saito (.2 WAR, -2.23 PE), Rodriquez (-3.48 PE, 1.4 WAR), Axford (-5.22 PE, 1.8 WAR), Loe (-.62 PE, 1.2 WAR), Hawkins (1.17 PE, .7 WAR) De La Cruz (.1 WAR, -.23 PE), Narveson (1.5 WAR, 1.36 PE), and Dillard (-1.01 PE, .3 WAR). Their lineup will look something like this: (in no order) Morgan (.018 WAR per game, 2.9 PAPP, .97 PPG), Braun (2.07 PAPP, .05 WAR per game, 1.9 PPG), Hart (2.52 PAPP, .03 WAR per game, 1.33 PPG), Lucroy (.003 WAR per game, 3.066 PAPP, .84 PPG), Fielder (1.52 PPG, .03 WAR per game, 2.24 PAPP), Weeks (.025 War per game, 2.6 PAPP, 1.3 PPG), Betancourt (.007 WAR per game, .91 PPG, 3.43 PAPP), and Hairston (.6 PPG, 2.94 PAPP, and .024 WAR per game).


The statistics show that the Brewers have the much better starting pitching. The bullpen is split, with the Brewers being more efficient, but the Cardinals a better WAR. The lineups are very even, all the statistics are close, the PAPP and WAR going to the Cardinals, while PPG going to the Brewers (but all by very small margins). So it is easy to call the lineups and bullpens a draw, and focus on the difference in starting pitching that favors the Brewers. So both the statistics pick and my pre-pick is the Brewers.

Friday, October 7, 2011

Series Review: Phillies vs Cardinals

So yeah. That happened. To cap off a great first round of postseason play, the Cardinals shock the Phillies, as Carpenter out-dueled Roy Halladay. The Phillies were my World Series pick, and statistically they were picked to win this series. The pitching match-ups were so stacked toward the Phillies. However, statistics are averages, and Cliff Lee pitched terrible, Roy Oswalt pitched terrible, and Edwin Jackson pitched amazingly. The Law of averages said this probably wouldn't happen, but the very unlikely happened. There really isn't any other way to explain it. The Phillies hitters were really unimpressive, and didn't successfully work counts and take pitches (only 3.5 pitches per plate appearances in game 5 with no walks). When you do that, you lose virtually every time. Ryan Howard did nothing in the last 3 games, and Pence, Polanco, Ibanez, and Ruiz all underperformed (and Ruiz and Ibanez were rated really low, not much were expected from them). The Cardinals bullpen, once considered a problem, performed very solid. Despite battling injuries Schumaker proved to be one of the best hitters in the series, and was pretty lowly rated. Just a goofy series, and it proved just about anything can happen in a 5 game series.

Pre-Statistics picks: 3-1
Statistic Picks: 0-4
Teams with higher payroll: 2-2
Interesting note: none of the top 9 payroll teams made it past the first round. The Tigers, 10th highest payroll, have the highest payroll out of teams remaining.

Series Preview: Tigers vs. Rangers

Pre-statistics (somewhat of a misnomer, just before I go over all the numbers like I did in original previews), I had the Rangers going to the World Series, so I have to stick with them for the pre-statistic pick. The Rangers are going to look like this in the starting rotation: Wilson (.148 WAR per start, -1.87 PE), Holland (.55 PE, .081 WAR per Start), Lewis (.061 WAR per start, .51 PE), and Harrison (.13 WAR per Start, 1.17 PE) as starting pitchers. Their projected bullpen looks like this Ogando (3.4 WAR, .3 PE), Feliz (-1.8 PE, .8 WAR), Gonzalez (-.55 PE, .2 WAR) , Adams (-5.24 PE, 1.7 WAR), Uejara (1.2 WAR, -7.09 PE), Oliver (-2.01 PE, 1.2 WAR), and Feldman (.98 PE, .2 WAR). Their lineup will probably look like (in no particular order): Hamilton (.03 WAR per game, 1.723 PPG, 2.42 PAPP), Cruz (.011 WAR per Game, 1.52 PPG, 2.74 PAPP), Murphy (2.74 PAPP, .966 PPG, Negative WAR), Napoli (2.13 PAPP, .045 WAR per game, 1.504 PPG), Kinsler (2.39 PAPP, 1.67 PPG, .035 WAR per Game), Andrus (.024 WAR per game, 1.32 PPG, 2.68 PAPP) Beltre (1.76 PPG, .043 WAR per game, 2.63 PAPP), Torreabla (.006 WAR per game, .75 PPG, 3.14 PAPP), and Young (.015 WAR per game, 2.5 PAPP, 1.33 PPG).

The Tigers, will use 4 starters it looks like: Verlander (-3.73 PE, .253 WAR a start), Scherzer (.44 PE, .073 WAR per start), Fister (.16 PE, .26 WAR a start), and Porcello (3.9 PE, .032 WAR a start). Detroit's lineup will probably look like this (in no order): Jackson, Young, Raburn, Cabrera, Martinez, Aviles, Ordonez, Peralta, and Inge. This adds up to a .127 WAR a game, 10.06 PPG, 25.864 PAPP. Their bullpen will include: Valverde, Coke, Benoit, Perry, Alburquerque, Schlereth, and Pauley. Their stats add up to -13.6 PE, and a 8.1 WAR.

This means that statistically, the Rangers have the better lineup (in fielding and hitting), and better bullpen. However, the Tigers (assuming the series goes 7 games) win 4 out of the 7 starting pitching match-ups (with Holland versus Scherzer twice going a draw statistically, Harrison versus Porcello is the only one the Rangers have a clear advantage on). Having the advantage in the other 3 areas put the numbers fully behind the Rangers.

Thursday, October 6, 2011

Series Review: Yankees and Tigers

A-Rod, while not rated high statistically this season and therefore was not a reason the statistics picked the Yankees, was an absolute disaster.  He struck out 6 times and went 2 for 18 in the series. In now big samples, it is apparent that A-Rod is not a very good postseason player, and he is still on the hook for a lot of money and a long time. It was the Tigers, not the Yankees, that took advantage of the short right porch, with multiple barely shouldn't be homers in that should-be illegal ballpark. C.C. Sabathia's performance in the series was disappointing and disrupted, and Ivan Nova had to pitch twice, and the statistics were clear, Fister is better than Nova. It showed in game 5. Verlander only pitched once (twice if you count that horrible first inning in game 1), and wasn't his best (5.00 ERA), but out-pitched Sabathia (6.23 ERA). Both bullpens, which the statistics basically called equal, pitched really well. Max Scherzer was lucky if not good for the Tigers, giving up tons of flyballs in his start, but still only having a 1.09 WHIP and 1.23 ERA for his two appearances. Also unexpected was Rick Porcello starting game 4, not Brad Penny (which I had written in the series preview). Not to mention that the 4th pitcher was supposed to face Sabathia and not Burnett. This really messed with the statistical preview. For the Yankees, Texiera had another mediocre playoff series, walking rarely and not coming with hardly any hits. For the Tigers, Delmon Young, an extremely overrated player with low statistical ratings, had a very big series with 3 homers and hitting over .300 despite chasing all kinds of bad pitches, Miguel Cabrera hit just .200 in the series, but as batting average is very overrated, he was very solid in the series and the Yankees had to repeatedly pitch around him. Maggolio Ordonez and Brandon Inge, both veterans who had terrible seasons, were very productive, and many of the holes the lineup had this year were at least taped up in this series. Again, metrics and statistics show what has happened over a period of time, but in a period of 5 games (1-2 for most pitchers, not to mention how the suspended game altered the pitching match-ups) things that statistical averages say will happen, may not happen. It is a small sample. I expect the statistics to do better in the 7 games series's and much better when I use the metrics to construct a season preview next year.
 
My Pre-Statistics picks: 2-0
My statistics picks: 0-2
Teams with higher payroll: 1-1

Thursday, September 29, 2011

Playoff Preview: Tigers vs. Yankees

This is the final series of the first round to be previewed. Before looking at the statistics, I had the Tigers winning the series because I felt they had better starting pitching depth and the lineups are similar.

It appears that the Yankees will go with just 3 starters, using Sabathia (.203 WAR per Start, -1.98 PE), Nova (2.24 PE, .129 WAR per start), and Garcia (.13 WAR a start, 1.7 PE). Their bullpen will probably include: Rivera, Robertson, Ayala, Colon, Laffey, Valdes, Soriano, and Logan. Their stats add up to a -8.37 PE and a 9.8 WAR. Their lineup will probably include (in no particular order) Granderson, Swisher, Martin, Texiera, Cano, Jeter, Rodriquez, and Chavez. Their stats add up to a .173 WAR per game, 13.344 PPG, 23.608 PAPP. The Tigers, will use 4 starters it looks like: Verlander (-3.73 PE, .253 WAR a start), Fister (.16 PE, .26 WAR a start), Scherzer (.44 PE, .073 WAR per start), and Penny (9.87 PE, negative WAR). Detroit's lineup will probably look like this (in no order): Jackson, Young, Raburn, Cabrera, Martinez, Aviles, Ordonez, Peralta, and Inge. This adds up to a .127 WAR a game, 10.06 PPG, 25.864 PAPP. Their bullpen will include: Valverde, Coke Benoit, Porcello, Perry, Alburquerque. Schlereth, and Pauley. Their stats add up to -9.7 PE, and a 10.8 WAR.

So while the Tigers have a better bullpen, the Yankees have a better lineup and better starting pitching. That is not good news for the Tigers and so I pick the Yankees after statistics.

Playoff Preview: Phillies versus Cardinals

I picked the Phillies to win the World Series, so of course I have them winning the series before statistics.

Everyone expects the Phillies to use this rotation: Halladay (.23 WAR per start, -2.75 PE), Lee (.22 WAR per Start, -3.52 PE) , Hamels (-2.33 PE, .17 WAR per start), and Oswalt (2.01 PE, .06 WAR per start). Their lineup should look like this (in no particular order): Victorino (.04 WAR a game, 2.5 PAPP, 1.47 PPG), Ibanez (1.2 PPG, negative WAR, 3.6 PAPP), Pence (.04 WAR a game, 1.44 PPG, 2.32 PAPP), Ruiz (.02 WAR per game, .72 PPG, 2.72 PAPP), Howard (.017 WAR per game, 2.58 PAPP, 1.53 PPG), Utley (.032 WAR per game, 2.79 PAPP, 1.17 PPG), Rollins (.025 WAR per game, 2.56 PAPP, 1.36 PPG), and Valdez (Negative WAR, 3.47 PAPP, .74 PPG). Madson (-3.08 PE, 1.7 WAR), Lidge (.3 WAR, -5.92 PE), Worley (-1.51 PE, 2.5 WAR), Stutes (-1.14 PE, 0 WAR), Bastardo (-5.83 PE, .7 WAR), Kendrick (.4 WAR, 2.29 PE), Blanton (2.45 PE, .5 WAR), Herndon (-.6 WAR, 1.16 PE), and Schwimer (-.1 WAR, .18 PE) should round out their bullpen.

For the Cardinals, the starting rotation should look like: Carpenter (.11 WAR per Start, .07 PE), Lohse (.083 WAR per start, 1.66 PE), Garcia (.028 WAR per start, .34 PE), and Westbrook (3.91 PE, Negative WAR).  Their bullpen maps out with these guys: Rhodes (2.95 PE, -.6 WAR), Rzepczynski (1 WAR, -2.07 PE), Dotel (-4.04 PE, .9 WAR), Jackson (1.38 PE, 3.8 WAR), Salas (-3.93 PE, 1 WAR), Mclellen (3.23 PE, negative WAR), Motte (-3.15 PE, 1.6 WAR), and Boggs (.3 WAR, .43 PE). They will probably run out this lineup (in no order): Jay (.01 WAR per game, 2.92 PAPP, .63 PPG), Berkman (.036 WAR per game, 1.5 PPG, 2.21 PAPP) , Holliday (.033 WAR per game, 1.48 PPG, 2.4 PAPP), Pujols (.037 WAR per game, 2.33 PAPP, 1.7 PPG), Freese (1.1 PPG, .019 WAR per game, 2.71 PAPP), Furcal (.028 WAR per game, 2.855 PAPP, 1.12 PPG), Schumaker (.005 WAR per game, 3.05 PAPP, .63 PPG), and Molina (2.71 PAPP, .99 PPG, .028 WAR per game).

As expected, the Phillies have the much better starting pitching. However, I still found it a little shocking just how much better is. The Cardinals' lineup does have a better WAR, and Plate Appearances per Positive play, but the Phillies have slightly better pop, with a better Production per Game. The bullpen situation is a little weird too, with the Cardinals having a much better WAR (perhaps slightly skewed by Edwin Jackson), but the Phillies have a much better Pitching Efficiency. All said, most of the numbers lean toward the Phillies, so I am sticking with the Phillies for this series.