The problems have mainly been control related, as his high walk rates have just gotten out of control. His wild pitches/passed balls have actually gone down, but he is throwing the ball in the zone less and throwing less strikes:
-->
| Season | Name | Zone% | Strike % |
| 2008 | Carlos Marmol | 52.70% | 62 |
| 2009 | Carlos Marmol | 51.70% | 59 |
| 2010 | Carlos Marmol | 50.30% | 61 |
| 2011 | Carlos Marmol | 51.10% | 61 |
| 2012 | Carlos Marmol | 48.40% | 59 |
| 2013 | Carlos Marmol | 46.90% | 60 |
Not surprisingly, this data comes with a change in release point. The following shows his average release point by year, with the strike zone in the map for reference.

His furthest out release point is where he was in 2008, and since then he has moved closer to the center of the plate at release point every year. He got a little lower in 2011, so in what was probably an attempt to rework mechanics, he started releasing the ball higher than he ever has before. This is where he is at now, the highest and closest to his body he has ever been.
Marmol is basically a two pitch pitcher and has been the whole time. There has been some regression in his velocity, and it has been somewhat inconsistent from season to season (this data is from FanGraphs, unlike the Pitch F/X data presented above in the release point charts and below in the location charts, which is pulled from Baseball Savant and the charts are mine)
| Season | Name | vFA | vSL |
| 2008 | Carlos Marmol | 94 | 82.3 |
| 2009 | Carlos Marmol | 93.9 | 83.5 |
| 2010 | Carlos Marmol | 94.1 | 83.7 |
| 2011 | Carlos Marmol | 91.8 | 83.2 |
| 2012 | Carlos Marmol | 94 | 84.7 |
| 2013 | Carlos Marmol | 92.7 | 83.7 |
Here is where his average pitch has been located each season regardless of pitch type (In the following graphs, the entire graph is the strike zone)
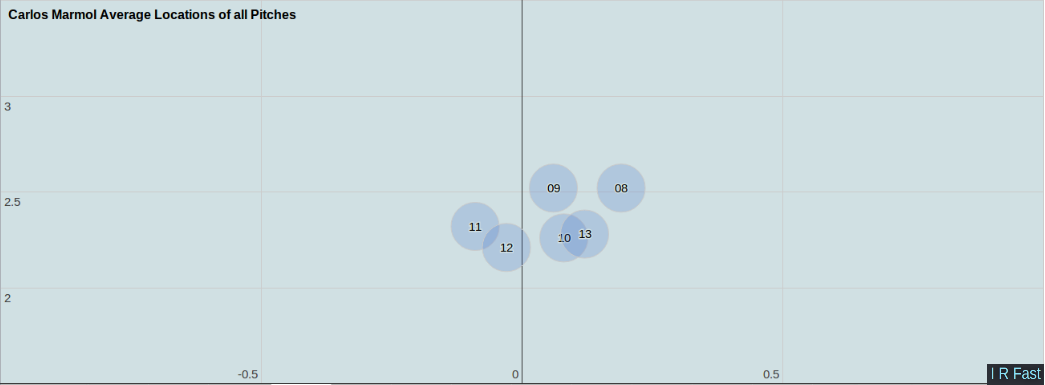
Marmol was a high ball pitcher in 2008-2009, but since then has become more of a low ball pitcher. He went from a glove side pitcher to an arm side pitcher for two seasons, but so far this year he has gone back to being a glove side pitcher.

Here we see somewhat similar results, with him actually going back to being a glove side pitcher with the fastball so far this season. It has never been a pitch he has thrown low on average, but in recent years it has been lower than it was when he was successful. With his slider, the changes are less dramatic:

The diminishing velocity makes the ceiling for Marmol going forward a lot lower. Even if they fix him mechanically (they have already designated him for assignment, so that seems to have been just talk), going back to the old release point that was further and out seems to be the best move if it is even possible, it is doubtful he will ever be the old Marmol again. With a fastball that is a tick or two slower, he probably won't be able to have the success with the high fastball that he once had, even if he is able to get the fastball up again.
No comments:
Post a Comment