Showing posts with label Yuki Matsui. Show all posts

Thursday, April 24, 2014

Yuki Matsui: Start Four

Yuki Matsui's fourth start of the season did not go well, as he walked eight batters and struck out six. In 127 pitches, he went five innings and gave up five runs. He was immediately sent down to the ni-gun after the game.

We will start the post the same way all the Matsui posts have been started, by looking at his velocity:

Matsui's velocity clearly declined as the start went on, especially towards the end, when he clearly shouldn't have been pitching anymore. Even his change and slider velocity dropped towards the end.

Matsui's big problem was obviously throwing strikes, as this graph shows what percentage of pitches he threw in the strike zone

Throwing less than a third of his pitches for strikes, it was clear that something was wrong with Matsui, or at the very least, he didn't belong in the Ichi-gun for the time being.

Looking at Matsui's results, we see that he still got whiffs despite his control problems:

Matsui got much more flyballs than groundballs, and got the same amount of called strikes as foul balls.

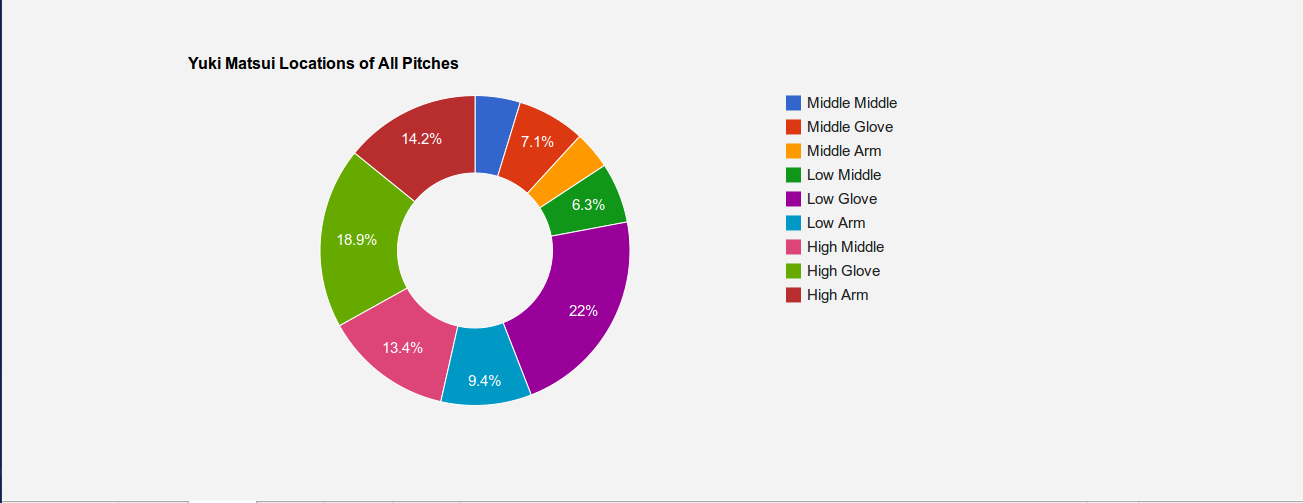
What may be helpful when discussing his problems with control is to look at is where he generally located all of his pitches:

Again, his favorite location was low and glove side, though he threw a lot of pitches high and glove side as well, meaning he was probably just yanking the ball overall. He also threw high more instead of low, while the majority of pitchers throw low more than high.

To further evaluate his outing and control problems, I think we need to look at his individual pitches. First, let's look at his overall pitch selection:

Notice how it appears that he has dropped the curve, at least in this outing. He stayed with the change more than the slider, and had a relatively normal amount of fastballs.

Looking deeper at his fastball, let's start by looking at the percentage of them he threw in the strike zone:

This rate is higher than his rates on sliders and changeups, but is still not an acceptable rate.

Here is where he generally threw his fastball location-wise:

This is where the high percentage of high glove pitches come from, though there was a good portion of low glove and high middle pitches as well.

Here were his fastball results for the game:


Matsui's whiffs didn't come from his fastball, and a higher volume of called strikes and fouls came the fastball.

I wanted to look at his locations of his other pitches, so let's start with the slider:


 This is where his high percentage of low glove pitches come from, though some of them stayed up a little and were middle glove.
 
His changeup locations:

Not surprisingly, this pitch was mainly located on the low arm side, with a good balance in the other zones. So really, the slider and changeups are in traditional locations, they just aren't finding the strike zone.

Wednesday, April 16, 2014

Yuki Matsui: Start 3

Yuki Matsui made his third start of the season on Wednesday April 16th, facing 26 batters in five innings and 101 pitches, giving up three runs, while striking out four and walking six against the Softbank Hawks. Like usual, let's start with the graphs and start with his velocity chart.


Unlike the last two starts, Matsui's velocity peaked in the middle of the outing instead of around the first of the outing. His slowest pitch overall was a curveball early in the outing. His fastball velocity dropped a little toward the end until his last start. Here are his average pitch velocities from the outing:

At least compared to his first start, his fastball velocity is down over a full kilometer, and his change is down about two kilometers. His slider and curveballs were actually faster though. Whether or not that is a classification error or not is tough to say.


Here is a pie chart that shows his pitch selection:

We still see a relatively low fastball usage, and it has actually been decreasing compared to his other two starts. He really fell in love with his slider in this particular start.

Again, Yuki Matsui struggled to throw pitches in the zone, as this chart shows:


 Since he struggled again to throw pitches in the strike zone, let's see where he located his pitches:


Once again, Matsui was very heavy to the glove side and low. Armside and high was his second favorite spot. He kept the ball out of the very middle of the plate though, even though he still gave up five hits.

Here are the results of each of Matsui's pitches broken into a pie chart:


His whiff percentage was pretty impressive, though his called strike percentage wasn't. To get a better look at pitch results, let's bring the velocity chart back up but instead of labelling each pitch with pitch type, let's label them with the results.

When he was throwing his hardest in the middle of the outing, he was throwing balls, which probably means that he was overthrowing. His breaking balls at the end of the game were also almost all balls, except for the one whiff. He got a couple of called strikes with early breaking balls, just like the early fastballs.

Here are the pitch locations for the balls put in play off Matsui:

As you can tell, things were pretty balanced, but his increase in pitches thrown arm side and high seemed to hurt him, as that is the location where most of the balls were put in play.

Here are the pitch types that were put in play off Matsui:


Not surprisingly, a plurality of them were fastballs, but his slider and change had higher percentages of contact than pitches thrown, meaning they were more hittable than the curve and fastball in this start.

For comparison, here are the pitch types that Matsui got whiffs with:

The slider was a risk-reward pitch for him in the outing as he gave up more contact than he should have with it, but it got him half of his whiffs.

Wednesday, April 9, 2014

Yuki Matsui: Start Two

Yuki Matsui made his second career official NPB start for the Rakuten Golden Eagles on Thursday, and packed 86 pitches into three and one thirds of an inning. Out of the 17 batters he faced, he struck out 7 and walked 5, with 2 runs and 3 hits. Similar to his last start, what follows will be a few charts and graphs on his start. Like last time, let's start with his full velocity chart from pitch to pitch:


While he threw less pitches, it does appear that he maintained his velocity a little better, though again, he peaked out early in the outing. When only looking at fastballs (all Matsui throws is the 4-seam fastball, or at least that is the only classification he has through two starts), I think we see this exaggerated a bit.


His fastball averaged about 87.48 MPH in the outing, between Dan Haren and Jason Vargas in the Majors in 2014. How does his pitch selection compare to his last start? Here is the pie chart from start two:


All three off-speed pitches saw increases, with him throwing less fastballs overall. The slider is what increased the most. The pitch actually lost about .2 kilometers per hour on average from his last start, slightly less than the fastball (.7 kilometers per hour on average). Here is how he located the pitch:


Low and glove side, where you want a slider to be, was the most common place, but too many of them stayed high or in the middle. Surprisingly, more than half (13 of 23) were actually thrown in the strike zone. Perhaps this is why he threw it so much, as he had problems throwing in the strike zone overall:


So the slider may have been the only pitch that Matsui could actually get over, and since it wasn't hit (his problem was walks not hits), then he had no incentive to go away from it. So where did he locate the majority of his pitches?


Because of the slider, low and glove side was the most common location, though he threw more pitches in the middle and arm side in this outing. A simpler chart:


He didn't throw hardly any pitches low and arm side or middle and arm side, which made me curious about his changeup locations, which you can see here:


Weirdly, he throws the pitch to the glove side, or at least he did in this start. Just one of the seventeen changeups turned out to be in the zone, so it is easy to see that he doesn't have much feel of the pitch.

Now, let's take a look at Matsui's results:


The higher volume of balls from last start isn't surprising, though he increased his whiff percentage and called strike percentage. When he threw strikes this time, he was more effective than his first start, as there was even a lower foul percentage.


Wednesday, April 2, 2014

Yuki Matsui: Start One

Yuki Matsui, the first pick in the 2013 NPB draft, made his NPB debut for the Rakuten Eagles on April 2nd against the Orix Buffaloes, pitching six innings, giving up three runs, striking out six and walking five over 112 pitches. Below is a short summation of his start using graphs and charts.

First, let's take a look at the velocity of his pitches by his pitch count (note, there a few blanks because the velocity of the pitch wasn't posted, as all data was copied from Yahoo, though all the charts are mine).

It seems that Matsui's velocity peaked early, and never returned to that peak, though he still threw a few pitches over 140 kilometers at the end of his outing. It also appears he used more slower breaking balls late. The next graph shows how his fastball velocity fared throughout the outing:

 Again, we see that his velocity was the best after his first few fastballs. However, there wasn't a real sharp decline, and stayed steady from the middle of the game to the late part of the game. Here are the average velocities of the four different pitch types he used:

As expected, Matsui isn't a hard thrower, though that level of velocity from the left-hand side in the NPB should play pretty well. His slider was faster than his changeup on average, and his curve and slider velocity difference is pretty normal. The following is his usage breakdown, showing how much he used each pitch.

His fastball usage is about normal (at least by American standards), and the change more than the slider usage could be explained by the right-handed heavy lineup of the Buffaloes. Here is how his pitch results broke down:

A less than 60% strike rate is not something to be desired, and his whiff and called strike percentages were a tad low, and the percentage of pitches he threw in the strike zone was a little low as well:

So we should dig a little more into location, and the following pie chart shows where each pitch was generally located.

As you can see, he was very heavily glove side, working across his body the majority of the time. As the next chart shows, this hurt him when it came to hits.


He was actually more likely to get whiffs when he stayed arm side.

One reason that he may have been working so glove side is the way he releases the ball:

As you can see, he is leaning quite a bit to the right when he lets go of the ball. This may cause him to crossfire, and throw in to right-handed hitters, something you usually don't want to do when you are not throwing especially hard.