Another injury riddled and roster moved filled two weeks for the Free Agent Fantasy Team:
Grilli, Slowey and Bogusevic all went to the DL and were placed on the Inactive team. Luis Cruz also went to the DL, but I just released him because I didn't want to use a minor league roster spot to keep him around.
Thomas Neal was brought up to big league team, but then went back down. I obviously updated his stats, but he stays on inactive team. Loney did go on paternity leave, but came back, so no roster move.
Melky Cabrera was activated off the DL and went to big league team. I also signed Humberto Quintero, who signed a big league contract with the Mariners, to get my big league roster up to 21. Since we are about 104 games into the season, he will make $171,852. I released Bobby Wilson from my minor league team to make room, as he wasn't hitting in AAA and I have plenty of catching depth now, with 3 on the big league team and Kelly Shoppach still on the minor league team. I also released Clay Rapada to put my inactive team back at 15.
Assuming 104 games played:
16.1 fWAR, 46.7 wins, 57.3 losses
16.2 rWAR, 46.8 wins, 57.2 losses
13 WARP, 46.3 wins, 57.7 losses
-2.9 WAA, 49.1 wins, 54.9 losses
The three replacement level metrics are the closest they have been all year, unifying as the wheels have absolutely fallen off of my team.
Showing posts with label Free Agent Fantasy Team. Show all posts
Showing posts with label Free Agent Fantasy Team. Show all posts
Sunday, July 28, 2013


Sunday, June 30, 2013
Free Agent Fantasy Team Update: Jason Grilli's Dominance
This time's Free Agent Fantasy Team Update contains a lot of roster moves, yet again.
I released J.C. Romero, who was on the MiLB DL and signed Randy Ruiz to take his place on the MiLB roster. I change Kevin Slowey's designation from SP to RP, as the Marlins have moved him to the bullpen. Roy Oswalt and Brian Bogusevic were promoted to the big league team, both get paid 234,240 dollars, unless something else is announced. Travis Ishikawa was promoted by the Orioles, but didn't play well and was quickly designated, so I just released him and won't take his numbers. Eric Chavez also goes to the big league team, coming off the DL. David Ross to the 7 day DL then the 60 day DL, so he goes to the inactive part of team and is a release candidate. Thomas Neal was optioned to minors so goes to minor league team, as does Melky Cabrera, who was placed on the 15 day DL. MLB team should be at 24. Hisanori Takahashi was traded from the Cubs to the Rockies, but will remain in AAA. It doesn't change his status on my team. I also signed Ben Francisco to fill out my minor league/inactive roster.
Since most teams have played about 81 games:
13.8 fWAR, 37.614 wins, 43.39 losses
14.2 bWAR, 38.014 wins, 42.99 losses
12.2 WARP, 38.12 wins, 42.88 losses
-.5 WAA, 40 wins, 41 losses
Yet again, WAA likes me the best, but I have now fallen below .500 according to all 4 metrics. WARP actually likes me more than the baseball reference WAR, which is a little strange considering WAA also comes from Baseball Reference (but I think comes from one of the biggest flaws in positional player WAR, as fielding and baserunning are weighed by average and the batting is weighed by replacement).
Jason Grilli was somewhat of an after thought signing for my team, just an attempt to use some extra money I had as a late signing and to make sure I had guaranteed bullpen depth. He has clearly been worth the money and has been one of the league's elite bullpen pitchers, proving that the good 2010-2011 seasons were no fluke. Grilli was a top prospect at the turn of the century, but he bounced around the league, with large inconsistencies.
For sake of comparison, let's look at Grilli's 2009 with the Rockies, where he was missing bats, but walking way too many hitters and had an ERA over 6, which even after a good 2008, ended his time as a member of the Rockies, as he was moved to the Rangers.

Here is Grilli so far in 2013:

He is a pure 2 pitch pitcher, and unless you believe the occasional changeup tag, this seems to be what he has been for virtually the whole Pitch F/X era (it seems that he used to throw a curve). This is a pretty dramatic change for their to be no real pitch usage changes. He has went from an arm side pitcher to a glove side pitcher, and is actually throwing the ball higher than he was before. Strangely, his average velocity of all pitches has stayed the same because he is throwing his fastball harder, yet his slider has lost velocity. Your guess is as good as mine as to how that it is possible.
There isn't a major release point change other than he is releasing the ball a little lower now, something that doesn't see to be unusual as a pitcher gets older. The location change, along with the fastball velocity uptick, seems to be why Grilli has improved. He isn't afraid to go high with the plus fastball and work on the other side of the plate.
Sunday, June 16, 2013
Free Agent Fantasy Team Update: Kevin Gregg's Success as a Cub
This week's Free Agent Fantasy Team Update contains a lot of roster moves:
Rick Ankiel was DFA'd and then released by Mets, so he is released from my team. I had missed that Dewayne Wise was on the DL, so I moved him to the inactive part of my roster. John Lannan will be back with the the Phillies to start on Monday, so I am putting him back on the big league roster. Shawn Camp was activated from the DL as well, so he moves to the active part of my roster. Thomas Neal was recalled by the Yankees, so he also moves from the minors/inactive part of the roster to the MLB part of the roster. Assuming that he is making league minimum, he is now owed $284,000. Chien Wang was also signed by Blue Jays, so I signed him to big league roster. He will also be owed 284,000 dollars. This puts my payroll at about 100.5 million dollars for the season. This also puts my big league roster at a full 24. It also means I had 2 spots open for my minor league/inactive team, so I signed J.C. Romero and Clay Rapada relievers who signed MiLB contracts in the past couple of weeks. Apparently Travis Ishikawa has exercised his opt-out clause, but that will probably take a couple of days to play itself out, so I am going to keep him on the inactive part of the roster as there was no update at the time of publishing. Now, let's see how my team is doing:
Since about 70 games have been played this season:
12.4 fWAR, 32.98 wins and 37.02 losses
13 rWAR, 33.58 wins and 36.42 losses
10.5 WARP, 32.9 wins and 37.1 losses
.4 WAA, 35.4 wins and 34.6 losses
So the three WARs have congregated to about as close as they have been all year. WAA continues to be the one that rates my team the highest, and I am only above .500 according to that measure.
Since all the roster moves made the post long, I just wanted to take a quick look at why Kevin Gregg may be having more success. My guess was location (as his 2013 stuff is nothing special), so here is his average locations from 2012 and 2013:
 He is keeping the ball lower on average this year, which could really play a role in his success so far. Let's break it down by pitch (MLBAM tags). 2012:


Rick Ankiel was DFA'd and then released by Mets, so he is released from my team. I had missed that Dewayne Wise was on the DL, so I moved him to the inactive part of my roster. John Lannan will be back with the the Phillies to start on Monday, so I am putting him back on the big league roster. Shawn Camp was activated from the DL as well, so he moves to the active part of my roster. Thomas Neal was recalled by the Yankees, so he also moves from the minors/inactive part of the roster to the MLB part of the roster. Assuming that he is making league minimum, he is now owed $284,000. Chien Wang was also signed by Blue Jays, so I signed him to big league roster. He will also be owed 284,000 dollars. This puts my payroll at about 100.5 million dollars for the season. This also puts my big league roster at a full 24. It also means I had 2 spots open for my minor league/inactive team, so I signed J.C. Romero and Clay Rapada relievers who signed MiLB contracts in the past couple of weeks. Apparently Travis Ishikawa has exercised his opt-out clause, but that will probably take a couple of days to play itself out, so I am going to keep him on the inactive part of the roster as there was no update at the time of publishing. Now, let's see how my team is doing:
Since about 70 games have been played this season:
12.4 fWAR, 32.98 wins and 37.02 losses
13 rWAR, 33.58 wins and 36.42 losses
10.5 WARP, 32.9 wins and 37.1 losses
.4 WAA, 35.4 wins and 34.6 losses
So the three WARs have congregated to about as close as they have been all year. WAA continues to be the one that rates my team the highest, and I am only above .500 according to that measure.
Since all the roster moves made the post long, I just wanted to take a quick look at why Kevin Gregg may be having more success. My guess was location (as his 2013 stuff is nothing special), so here is his average locations from 2012 and 2013:


2013:
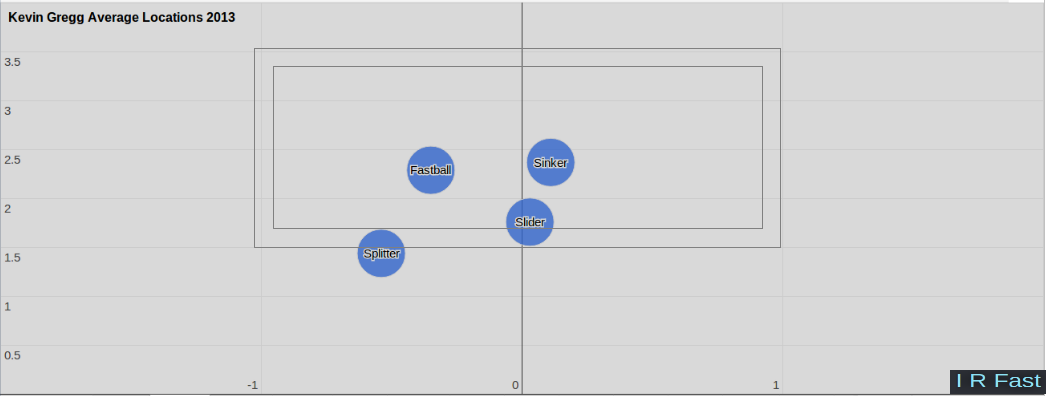
The fastball is clearly more arm side, rather than in the middle of the plate, while his sinker is more glove side. He is also locating the slider and splitter lower in the zone, which, along with moving to the NL Central from the AL East, is probably playing a big role in his success so far with the Cubs.
Sunday, June 2, 2013
Free Agent Fantasy Team: Melky Cabrera's Decline
We are now two months into the regular season, and it is time for the bi-monthly update of my all free agent fantasy team.
Roster Moves: Shawn Camp and Eric Chavez both go on the DL, so placed on the minors/inactive part of roster, as my injuries continue to mount. David Ross goes back on the active part of the roster after being activated. To clear the second spot on the inactive list, I released Matt Downs, who was not hitting at all in the PCL for the Marlins. I was sort of interested in Jon Rauch for the inactive list, as he signed a minor league deal with the Orioles, but couldn't bring myself to clearing a spot for him. I would have ironically added him if he signed a MLB deal, like Ankiel or Gregg.
Since most teams have played about 56 games:
9.7 fWAR, 26.16 wins and 29.84 losses
11.2 rWAR, 27.664 wins and 28.336 losses
9.2 WARP, 27.12 wins and 28.88 losses
.9 WAA, 28.9 wins and 27.1 losses
So after a really slow start, and then a recovery that put me over .500, my team has regressed to a slightly below average team through two months.
In this week's player profile, I wanted to look at Melky Cabrera from 2010-2013.
Cabrera was a below replacement player in 2010 with the Braves and was released after the season. 2011 and 2012 were his big offensive years, playing for the Royals and Giants. He was then suspended for PEDs and signed with the Blue Jays in the off-season. So far this year, he has been a slightly below league average hitter.
Keeping in mind that he is a switch hitter, meaning that he will bat lefty more than righty, here are where pitchers have thrown the ball to him on average broken down by year:

There is no real difference in how he is being pitched as far as average location goes. This probably means that there has not been an obvious flaw in his swing that he either fixed after 2010 or has had exposed in 2013. Here are the average pitches he has swung at, broke down by year, along with his hits (for the purpose of this post, I am only referring to the "In Play, no outs" plays when talking about hits) for each season:
 The most significant difference is his hits so far in this season, coming more low and away when he bats left-handed. To further break down each year (and get a look that hopefully tells us more than his the above charts), I will look at his spin and speed charts on hits and whiffs for each year. Here is his 2010 spin and speed chart on pitches he swung and missed at:
 Here were the pitcher release points on his whiffs:

Here are the release points he got hits off of in 2010:


Controlling for the difference in volume, they look pretty similar. He hit some curveballs, a few changeups as well, though he didn't seem to excel against plus velocity as well. Here are the release points of the pitchers Cabrera got hits off of in 2012:


Roster Moves: Shawn Camp and Eric Chavez both go on the DL, so placed on the minors/inactive part of roster, as my injuries continue to mount. David Ross goes back on the active part of the roster after being activated. To clear the second spot on the inactive list, I released Matt Downs, who was not hitting at all in the PCL for the Marlins. I was sort of interested in Jon Rauch for the inactive list, as he signed a minor league deal with the Orioles, but couldn't bring myself to clearing a spot for him. I would have ironically added him if he signed a MLB deal, like Ankiel or Gregg.
Since most teams have played about 56 games:
9.7 fWAR, 26.16 wins and 29.84 losses
11.2 rWAR, 27.664 wins and 28.336 losses
9.2 WARP, 27.12 wins and 28.88 losses
.9 WAA, 28.9 wins and 27.1 losses
So after a really slow start, and then a recovery that put me over .500, my team has regressed to a slightly below average team through two months.
In this week's player profile, I wanted to look at Melky Cabrera from 2010-2013.
Cabrera was a below replacement player in 2010 with the Braves and was released after the season. 2011 and 2012 were his big offensive years, playing for the Royals and Giants. He was then suspended for PEDs and signed with the Blue Jays in the off-season. So far this year, he has been a slightly below league average hitter.
Keeping in mind that he is a switch hitter, meaning that he will bat lefty more than righty, here are where pitchers have thrown the ball to him on average broken down by year:

There is no real difference in how he is being pitched as far as average location goes. This probably means that there has not been an obvious flaw in his swing that he either fixed after 2010 or has had exposed in 2013. Here are the average pitches he has swung at, broke down by year, along with his hits (for the purpose of this post, I am only referring to the "In Play, no outs" plays when talking about hits) for each season:


Here are the release points he got hits off of in 2010:

Despite always having the platoon advantage, he struggled against low and out righties. He was also more likely to struggle against far out lefties. Here is the spin and speed chart on his hits in 2010:

Curveballs were clearly a huge problem for Cabrera, as the bottom left of the swinging strike spin and speed chart shows. He didn't swing and miss against a 97 MPH + fastball and even hit some, and he seem to get hits about as often as he whiffed on fastballs over 94 MPH. For whatever reason, he didn't seem to do a lot with averagish fastballs, but he ripped up below average fastballs pretty well. He didn't seem to do extremely well against the area you would call changeups, at least from a ration perspective.
What changed in 2011? Here is his speed and spin on whiffs:

Still a lot of curveballs and a lot of hard fastballs, what about the release points on whiffs?

He still seemed to struggle with low and out pitchers. Compare the above chart to the release points he got hits off of:

He had success against low and out righties, but not low and out lefties. It seems like the higher the lefties, the more likely he was going to hit it. The cluster against right-handers was further from the center than the whiff release points, which is what you would expect. Here are the pitch types Cabrera hit in 2011:

Much better than the year before, Cabrera hit curveballs. He also hit a lot of above average fastballs, along with some changeups as well. Obviously there were more hits in 2011, but there was also a lot more balance when it came to pitch type.
In 2012, Cabrera would have won the batting title if it weren't for the
suspension and the bad publicity. Switching up the order a bit, here are
the pitches he hit that season:


Cabrera really excelled against pitchers with tall release points, especially right-handers. Here are the release points he whiffed against that season:

The tall ones didn't making him whiff, but neither did the short ones, as it seems that he mainly whiffed against relatively normal release points. Here are the actual pitches he missed:

Again, it seems that he didn't handle top notch velocity as well, and he had a lot of whiffs on curveballs. It isn't as pretty as it was in 2011. What about so far in 2013?

The difference in volume makes it hard to compare, so here is the spin and speed on hits so far this season:

He seems to have reverted back to having problems with curveballs, but he seems to be handling what you would normally call sliders well, and it doesn't appear he is having any problems with velocity. Here are the pitchers he has hit so far:

Here are the pitchers he has whiffed against this year:

He seems to be struggling as a right-handed hitter so far, and he is having a lot of problems with low and out release points, points he should never have problems with as a switch hitter, but points he was clearly having problems with earlier in his career.
He seems to have fallen into a bit of his old habits, struggling against curveballs and funky release points. The bat speed still appears to be there and he can still hit fastballs, it looks like his approach is a bit out of order right now, so it is unlikely to expect a 2011-2012 Cabrera, but it doesn't look like he has actually lost "talent" in way of bat speed, though the power hasn't shown up yet.
Sunday, May 19, 2013
Free Agent Fantasy Team: Jeff Keppinger's Horrible 2013
This week's Free Agent Fantasy Team update actually contains a few roster moves. First, I signed Rick Ankiel to the big league team with the Mets. I am assuming that it is for league minimum prorated over the rest of the year. For now, we will assume he is owed 367,500 dollars. This brings my payroll up to 99.9785 million for the season, meaning I have about 8.02 million dollars for the rest of the season. I also had to move David Ross to the minors/inactive part of the team as he is on the 7 day concussion DL. To make room, I released Mitch Maier, who has played all of 8 games in the minors this year. Here is the numbers for my team:
Since most teams have played 42 games so far:
7.2 fWAR, 19.548 wins, 22.452 losses
9.7 rWAR, 22.048 wins, 19.952 losses
7.3 WARP, 20.74 wins, 21.26 losses
2.1 WAA, 23.1 wins, 18.9 losses
Again, WAA likes my team the best, but we are over .500 by two metrics now, with Fangraphs liking the team the least again.
Jeff Keppinger has been the most frustrating player on the team (if you don't count Ryan Madson's ever evolving injury situation), getting a 3 year contract after a good season with the Rays and hitting .188/.190/.208 through a month and a half. Keppinger finally drew his first walk this year earlier this week, which even for his contact happy ways is amazing.
This graph shows where pitchers are pitching him on average by count:
 Here are the pitches Keppinger is swinging at:
 There are some definite chases, but most of the pitches are obviously in the strike zone.
Here are the pitches he is taking:
 Even when he is taking, the pitchers are filling up the strike zone. Even with no strikes, as we saw in the first chart, pitchers are basically throwing it right down the middle. It is not like he is just chasing wildly and not seeing strikes.
Since pitchers are throwing him so much strikes, you wonder if bat speed is a problem (after all, he isn't making them pay), so here are the locations and results on fastballs over 95 MPH:
 Most of them are thrown for strikes and thrown away from him. He has put quite a bit in play, but they are almost all for outs. It is contact, but contact that is not paying off. According to Baseball Heat Maps, he isn't hitting the ball as far:
2012: 173.864 feet on average
2013: 162.152 feet on average
Of course, there is a catch/no-catch bias in these numbers, so if he is having a large amount of balls just hit right at people, then it is going to show up in batted ball distance.
Here is Keppinger's spray chart (Texas Leaguers) at this point last year:
 So far this year:
 While he was hitting the ball harder last year according to the batted ball distance, his spray chart, if you ignore hits versus outs, looks better this year. Other than a pair of pulled homers, he was not hitting the ball very hard at all. He is driving the ball to center much better this year, it just isn't turning into hits. It is really hard to imagine his final line looking pretty at the end of the year, but he should "regress", and start hitting better than he has results wise. I think the best approach here is to be patient and give him more time (certainly the White Sox aren't going to already give up on a 3 year contract).
Since most teams have played 42 games so far:
7.2 fWAR, 19.548 wins, 22.452 losses
9.7 rWAR, 22.048 wins, 19.952 losses
7.3 WARP, 20.74 wins, 21.26 losses
2.1 WAA, 23.1 wins, 18.9 losses
Again, WAA likes my team the best, but we are over .500 by two metrics now, with Fangraphs liking the team the least again.
Jeff Keppinger has been the most frustrating player on the team (if you don't count Ryan Madson's ever evolving injury situation), getting a 3 year contract after a good season with the Rays and hitting .188/.190/.208 through a month and a half. Keppinger finally drew his first walk this year earlier this week, which even for his contact happy ways is amazing.
This graph shows where pitchers are pitching him on average by count:


Here are the pitches he is taking:

Since pitchers are throwing him so much strikes, you wonder if bat speed is a problem (after all, he isn't making them pay), so here are the locations and results on fastballs over 95 MPH:

2012: 173.864 feet on average
2013: 162.152 feet on average
Of course, there is a catch/no-catch bias in these numbers, so if he is having a large amount of balls just hit right at people, then it is going to show up in batted ball distance.
Here is Keppinger's spray chart (Texas Leaguers) at this point last year:


Sunday, May 5, 2013
Free Agent Fantasy Team: A Look at Kevin Slowey
At Fantasy CPR, I had been updating my all free agent fantasy team, but at the request of the editor, I will start updating it here instead. Instead of posting every week and going up on Monday, I'll post it just every two weeks (along with some notes, usually a pitch f/x look at one of the players), and post it on Sunday. If you aren't familiar with the idea, here is the original post.
First, Roster Moves for the week:
Randy Wells, who was in my minor league system, retired, so he moves to the released bin. In his place, I signed Roy Oswalt, whom the Rockies signed to a minor league deal. Evidently he can make up to 4 million dollars if he hits all of his intensives, but for now, I'll just classify it as a MiLB contract until we know the actual numbers (and he is promoted to the Majors). Here is a look at the team with updated WAR numbers:
Since most teams in the Majors have played about 30 games, here is how my team is doing:
3.2 WARP, 12.8 wins to 17.2 losses
3.3 fWAR, 12.12 wins to 17.88 losses
5.5 rWAR, 14.32 wins to 15.68 losses
.1 WAA, 15.1 wins to 14.9 losses
Clearly, some guys are turning a corner, and the team is looking a little better because of it. As much press as Jeff Keppinger is getting for his horrible start, Maicer Izturis has been just as bad. One of my favorite stories of the team so far (other than James Loney's unsustainable start and getting any value out of Kevin Gregg, who I used as a roster filler) is Kevin Slowey. Slowey had a pretty poor year with the Twins in 2011, and then was traded twice in the following off-season, pitching in AAA and then going on the DL for the rest of the 2012 season. The Marlins signed him to a MiLB deal, and he has pitched quite nicely so far this year, with a 80 FIP - and 3.55 kwERA. He has done it in typical Slowey fashion, not striking out many hitters and walking very few. The big difference is the home run rate. Statistically, that is going to take longer to stabilize than strikeout and walk rates (which are about career average for Slowey right now). However he does seem to be getting a little bit softer contact.
From 2007-2011, the average batted ball Kevin Slowey gave up (non-bunts, no minimum distance, according to baseball heatmaps) went 203.872 feet. So far in 2013, it is going 194.312 feet.
Here is his spray chart against in 2011 at home (via katron.org):

Here it is in 2013 (remember that all distances and spray charts are where the ball ends up):

The biggest difference I see is that he is giving up less power to right field. This is a little odd, because he is pitching mostly glove side this season (in number form, 325 pitches on the glove side of the plate and 242 pitches on the arm side of the plate), where you would expect balls to go to right field (pulled by lefties or the other way by righties):

So what are some things that might tell us why he is having this success pitching glove side? For one, Slowey is standing more upright in his delivery than he ever has.
Here is his release point so far in 2013:

Here is his release point in previous years (each point is a pitch and a year, data taken from Brooks Baseball):

His average before 2013 was about 5.88 vertically and -2.16 horizontally. This year, it is -2.06 horizontally (basically the same), but 6.12 vertically. Zack Greinke and Esmil Rogers are his new closest comparisons, while Chan Ho Park was his previous closest comparison. While Park's delivery was actually good and prototypical, the Rogers and Greinke comparisons are more desirable obviously. However, while it may explain some general success (a more upright delivery is better), it doesn't help explain the glove side success, as both Rogers and Greinke are more arm side pitchers in the strike zone than glove side pitchers (using Brooks Baseball's frequency maps, Park was actually more of a glove side pitcher). I think the main thing for Slowey is that he likes to keep the ball away, which you see when you look at pitches thrown just to left-handed hitters (114 glove side pitches, 144 arm side pitches):

I put the little box in the up and in corner to left-handed hitters to illustrate the point that he is avoiding the part of the strike zone to lefties where they can easily pull a ball for a homer, especially since Slowey has a below average fastball in velocity. Historically, Slowey has thrown pitches in that corner about 5.1% of the time, which is more than a normal right-handed pitcher would throw up there (based on Brooks' maps again). Against lefties, he has thrown a pitcher up there a little less, at 4.3 %, but that is much higher than a normal right-handed pitcher will throw it there against a lefty. From my count (looking at just the data itself), he has thrown just 8 in that highlighted zone (.5 to 1 horizontally and 2.5 to 3.5 vertically) against lefties, which is less than 3.1 percent of his pitches against lefties. Perhaps if he is able to keep this up, that is, throwing away and keeping it out of hitters happy zones, he will be able to limit home runs and be a somewhat better pitcher than he was before (especially if he can keep his strikeout and walk rates the same and continue keeping the ball away).
Subscribe to:
Posts (Atom)