Saturday, May 3, 2014

Breaking down Takayuki Kishi's No-Hitter

On Friday, Seibu Lions right-hander Takayuki Kishi threw a no-hitter against the Chiba Lotte Marines, completing the shutout in 117 pitches. For this week's look at a NPB pitcher, with Yuki Matsui still in the Ni-gun, I thought it would make sense to look at his no-hitter and see how he was so successful in his outing.

First, let's take a look at his pitch velocities, labelled with the Yahoo tags, along with his pitch count.


He did an okay job of holding his velocity throughout, though his fastest fastballs came at the very beginning of the game. He then fell a couple of ticks down for a while before a short spike. He then slowed down again before his last couple of fastballs when he got his fastball up to about where it was at the very beginning of the game.

While Kishi has been a good NPB pitcher for quite sometime now, he is not a household name, especially for those who do not follow the NPB with regularity. So I think it might be helpful to see what the average velocity of his pitches were in the game, just to give a better idea of what his average stuff is like. The bar itself is based on KMH, while the number in the parenthesis is in MPH:


He is not a hard thrower by MLB standards, and only really average at best when compared to NPB standards. He has a slow hook, and a change that is under 80 MPH, but his slider has a respectable velocity of 81-82 MPH. 

In an attempt to see how Kishi was successful in the game on Friday, let's look at how often he used the four pitches he showed off:

He used his fastball a relatively normal amount, and didn't seem to fall in love with any of his off-speed pitches. His slider was his least used pitch, while his change was his second most used pitch. This may have to do with the platoon of the opposing batters.

Obviously Kishi didn't give up any hits, but a further look at his pitch results may reveal exactly why he didn't give up hits:

Notice that he was much more of a flyball pitcher than a groundball pitcher, and his whiff percentage was only slightly above average. He gave up a lot of contact and didn't strike out a lot of hitters. However, this shows that he threw a lot of strikes.

Where exactly did he throw these pitches? This graph should give us a good idea:
Overall, Kishi was pretty balanced, not ignoring a location, or focusing on just one. Low in the strike zone seemed to be the norm, as glove low and arm low were his two favorite locations. However, middle low was his least frequent, meaning that he threw it to one side when he threw it low, which matches what we see on high pitches. He also stayed out of the very middle of the plate.

What is impressive about this last fact is that Kishi threw a large amount of pitches in the strike zone:


The above graphs suggest that he lived on the corners of the strike zone very well.

The last four graphs will be about his fastball, with the first two showing his fastball results by velocity and pitch count, and then by percentage.

Strangely, many of his hardest thrown fastballs were either fouls or balls. Most of the flyballs came on the middle velocity fastballs or the slowest fastballs, not surprising. He also seemed to get whiffs with his fastball earlier in the game than later in the game. The graph seems to show the uptick in velocity back to where it was at the beginning of the game late that I noted in the first graph.

Oddly, his fastball was a more efficient whiff pitch than his other pitches, but it also ended up being foul balls a lot as well. His strike percentage was exceptionally high with the pitch, as was his flyball percentage.

Now, let's look at how he located the fastball, first by velocity and pitch count:

Now by percentage:

He really liked to throw it high, and he balanced keeping it arm side, glove side, and middle while doing so. When he threw it low, it was usually arm side. He almost never kept it arm side and in the middle of the plate.

Monday, April 28, 2014

Masahiro Tanaka: Start Five

Masahiro Tanaka's fifth start of the season was his shortest so far, but still relatively successful, as he went 6.1 innings and gave up two runs, including a homer, and struck out 11 and walked 4 against the Angels. Through five starts this year, Tanaka has given up 10 runs, but 5 homers. He has a 2.27 ERA and a 2.91 FIP.

Like usual, let's start by looking at the home run Tanaka gave up, this time to David Freese, on the first pitch of an at-bat.

Freese is a right-handed hitter, so the fastball was actually up and away from him. For comparison, here is how Tanaka pitched him in the other at-bats.

Tanaka went middle to high and away twice more, and gave up contact again, though for an out, and got a foul ball. When he stayed inside, he was more successful.

Here is Tanaka's spin and speed chart from the game:

Perhaps this was just affected by the park, but it seems that there were more high spin splitters in this outing. Let's see if there was any major differences in how he located in this outing compared to other outings:

The curve was still relatively high, but this time he really struggled to get the slider down. He also couldn't get the sinker glove side enough to get inside the strike zone, though his splitter was still located well. Now, here is an average result location graph for comparison.

Tanaka was more likely to give up a foul ball when he went furthest glove side. His furthest arm side pitches were the most likely to give up runs. His whiffs, yet again with the splitter, came low and arm side. It appears that they came further arm side than his average splitter as well, suggesting that his furthest arm side splitters were the best. Strangely, pitches down in the zone were less likely to turn into outs, while his outs and called strikes were basically the same, arm side and middle.

This graph will show whether or not Tanaka was able to successfully locate away from both lefties and righties:


This graph not only shows how low he threw on average (as the entire graph is an approximation of the strike zone), but it also shows that he never really got the ball glove side consistently. He was always arm side, which was good against lefties, but not as good against righties.

Tanaka's groundball percentage was the second best out of his five starts, and this time, there was a big difference between the two

Tanaka got groundballs when he stayed arm side and low, like the splitter, but gave up flyballs when he went higher and glove side, like the slider or fastball. Digging further into location, the next two graphs will look at how he located by the count in the at-bat. First, let's look at his average locations by balls in the count:

With no balls in the count, he was more likely to go higher in the zone, but the deeper into the count he got, he went lower. The lowest, and only glove side location on average, was with two balls. With one ball and three balls, he located nearly exactly the same, which seems a little strange. Here is how he located by strikes in the count.

With no strikes, he located just about everywhere, which brings his average to be right down the middle. With one and two strikes, he really attacked low, bringing his splitter more into play.

Lastly, let's see if he located any differently based on what inning it was:

In his short time in the 7th, he threw the lowest and the most glove side of all his innings, though it is notable his other glove side inning was the beginning of the game. The third was a strange inning, in that it separated his consistent 2nd, 4th, and 5th innings. The 6th inning was odd in that it was his highest zone and extremely arm side.


Sunday, April 27, 2014

Breaking Down Shohei Otani's Most Recent Start

With Yuki Matsui now in the Ni-Gun, I wanted to continue my breakdown of NPB starts. So until he gets back up, I will look at individual starts of notable NPB pitchers, with this one being about Shohei Otani's start on April 27th against the Chiba Lotte Marines. Through four starts this season, Otani has struck out 28 batters and walked 7 with a 2.83 ERA in 22 innings. His start against the Marines was his worst so far, as he still struck out 9 in 7 innings and walked just 1, he gave up 2 home runs and 5 runs, all earned.

Let's start looking at his start by looking at his velocity and pitch count chart:

It appears that Otani maxed out at the end of his outing with his fastball. At the beginning, he started slow for him, and built up to around the 40-50 pitch mark before decreasing again. Once he got to about 100 pitches, he started throwing as hard as he could, with both his fastball and his splitter/fork. His slider velocity basically moved the same way his fastball velocity.

So since this wasn't a great start for Otani, let's break down his results:

It seems that he gave up a lot of fall balls, but he had a good strike percentage and got plenty of called strikes. His whiff percentage was only about average. Looking at the pitches he threw in the strike zone, it appears that if anything, Otani threw too many pitches in the strike zone.
Here is where Otani liked to locate his pitches in the outing:
Otani threw a great number of pitches low and to the glove side. However, Otani's second biggest location was right down the middle, perhaps confirming that he threw too many hittable pitches (as the two home runs show). Middle arm and high glove were his least frequent locations. Otani only threw three different kind of pitches, and his pitch breakdown may give us an insight on why and how he located:

His fastball percentage was perhaps a little low, and he threw a lot of sliders, which may be why he located so many pitches low and to the glove side. One of the home runs he gave up was on the fork (splitter) and another on a fastball. Looking further into his pitch selection, the following two graphs breakdown how he got groundballs, and how he got flyball. As the second graph shows, he gave up more flyballs than groundballs:


Otani was more likely to get groundballs off the fastball, and flyballs off the slider. His forkball was also more likely to get flyballs.

Since, like most pitchers, Otani's main pitch is his fastball, let's compare the pitch to his overall results and locations.

Clearly Otani located the fastball to the low glove side less than his slider. Surprisingly he threw less pitches down the middle with the fastball than his other two pitches. Middle glove and low arm side were two locations that saw increases, as well as high arm.

Otani's fastball results:
The fastball is where a good number of his foul balls came from, and his strike percentage was higher with the fastball. His whiff percentage was lower with the fastball. The following graph also shows that he threw more pitches in the strike zone with the fastball than his other two pitches:

Thursday, April 24, 2014

Yuki Matsui: Start Four

Yuki Matsui's fourth start of the season did not go well, as he walked eight batters and struck out six. In 127 pitches, he went five innings and gave up five runs. He was immediately sent down to the ni-gun after the game.

We will start the post the same way all the Matsui posts have been started, by looking at his velocity:

Matsui's velocity clearly declined as the start went on, especially towards the end, when he clearly shouldn't have been pitching anymore. Even his change and slider velocity dropped towards the end.

Matsui's big problem was obviously throwing strikes, as this graph shows what percentage of pitches he threw in the strike zone

Throwing less than a third of his pitches for strikes, it was clear that something was wrong with Matsui, or at the very least, he didn't belong in the Ichi-gun for the time being.

Looking at Matsui's results, we see that he still got whiffs despite his control problems:

Matsui got much more flyballs than groundballs, and got the same amount of called strikes as foul balls.

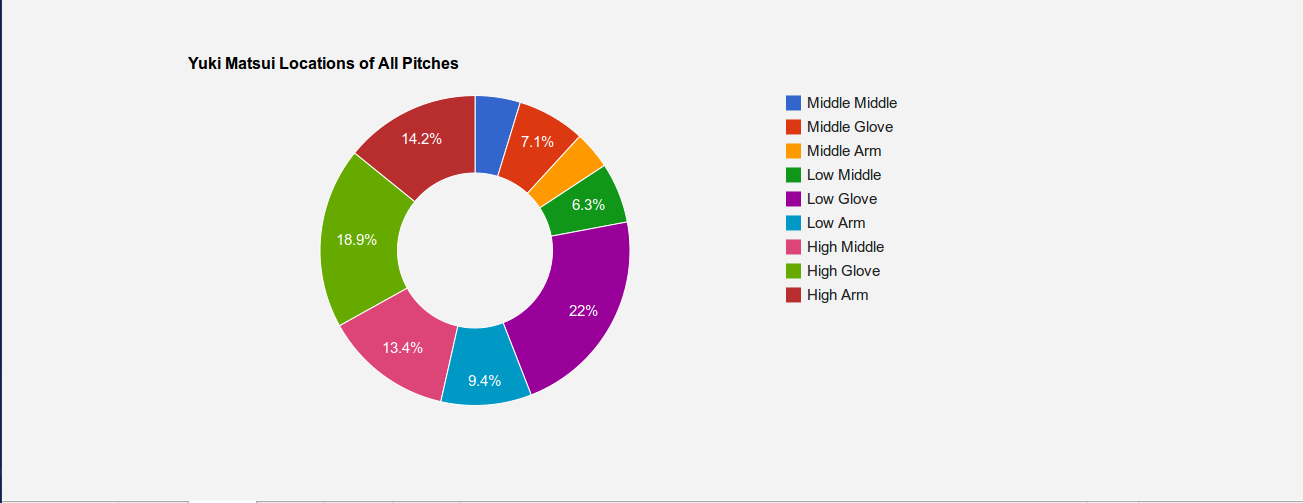
What may be helpful when discussing his problems with control is to look at is where he generally located all of his pitches:

Again, his favorite location was low and glove side, though he threw a lot of pitches high and glove side as well, meaning he was probably just yanking the ball overall. He also threw high more instead of low, while the majority of pitchers throw low more than high.

To further evaluate his outing and control problems, I think we need to look at his individual pitches. First, let's look at his overall pitch selection:

Notice how it appears that he has dropped the curve, at least in this outing. He stayed with the change more than the slider, and had a relatively normal amount of fastballs.

Looking deeper at his fastball, let's start by looking at the percentage of them he threw in the strike zone:

This rate is higher than his rates on sliders and changeups, but is still not an acceptable rate.

Here is where he generally threw his fastball location-wise:

This is where the high percentage of high glove pitches come from, though there was a good portion of low glove and high middle pitches as well.

Here were his fastball results for the game:


Matsui's whiffs didn't come from his fastball, and a higher volume of called strikes and fouls came the fastball.

I wanted to look at his locations of his other pitches, so let's start with the slider:


 This is where his high percentage of low glove pitches come from, though some of them stayed up a little and were middle glove.
 
His changeup locations:

Not surprisingly, this pitch was mainly located on the low arm side, with a good balance in the other zones. So really, the slider and changeups are in traditional locations, they just aren't finding the strike zone.

Tuesday, April 22, 2014

Masahiro Tanaka: Start Four

Masahiro Tanaka made his fourth start of the season on Tuesday, pitching in Fenway Park and going seven and one thirds of an inning, walking no one and striking out seven. He gave up two runs, both solo homers, to go with seven hits. Tanaka has now given up one home run per start (two against the Red Sox, none against the Cubs), and let's start this post by looking at the two home run at-bats, which actually came right in a row.

The first was to left-hander David Ortiz:

Other than one low and in fastball out of the zone, Tanaka stayed away from Ortiz, but notice that the home run ball was closer to the middle of the plate than the other three pitches.

The second was to right-hander Mike Napoli:

This time, Tanaka continued to go arm-side, but against Napoli, that meant he was going inside. The pitch that was most up and in, what appears to be a sinker that didn't sink, turned into the homer by Napoli.

For comparison, here is how Tanaka pitched David Ortiz in the non-home run at-bats:

Tanaka mainly kept the ball up and away, but notice that he got two swinging strikes by keeping the ball low and in the middle of the plate, similar to where the homer had been hit.

And here is how he pitched Napoli in the other two times he faced him:

Tanaka was much more successful at keeping the ball away in both at-bats, but got burned again by going up and in.

Here is what Tanaka's overall pitch selection looked like from a spin and speed perspective, labelled with MLBAM tags:


One thing that stands out is fewer curveballs. Also, Tanaka threw more four seamers than sinkers. However, the most prominent thing was his velocity. It seems that he threw more pitches over 95 MPH than he had in any other start. This is probably not park related, as Fenway Park is actually known to be a "cold" park when it comes to velocity. For whatever reason, it appears Tanaka was just throwing harder.

Since we looked at location in individual at-bats, let's compare how he located each pitch on average:

Again, I think we see why he went to the curve so rarely, as he still hasn't got it down like you would want. However, he kept all his pitches down on average, and had good horizontal differential with his sinker and fastball. His splitter stayed below the strike zone on average and the slider was in a decent spot.

For comparison, here is his average result locations:

 Not surprisingly, he had more success going glove side, showing that the slider and fastball were effective. His sinker really seemed to hurt him against Boston.

Tanaka's groundball rate wasn't bad against the Red Sox, but he fell short of the 50% mark that he posted in the first three starts. Here is where he located the average pitch that was hit on the ground and the average pitch that was hit in the air.


This time, there was basically no difference on average. Next, continuing to look at pitch results, I wanted to do something different, giving a visual look using movement, something we haven't looked at since Tanaka's first start. So here is a simple average strike, ball, and contact movement chart:


There seems to be a considerable difference when it comes to movement and results for Tanaka, at least in this start. An average movement chart with each pitch type will most likely demonstrate which pitches were the most effective:


This again seems to support that his fastball and slider were effective and his sinker was not. Notice that his splitter and slider have low vertical numbers, and
his balls and contact pitches had higher vertical numbers on average.