Showing posts with label Pitching. Show all posts

Wednesday, November 27, 2013

AFL Pitch F/X Data: Sequencing

Taking a break from looking at batting results, I wanted to take a quick look at another subject that has been very important in recent Pitch F/X research, pitch sequencing.

I think a good way to start is to approach sequencing the same way I did, looking to at-bats that contained both a whiff and a home run, meaning that the pitcher was able to make the batter swing and miss on one pitch, only to give up a home run later in the at-bat. There were 6 such at-bats in the AFL Pitch F/X games:


4 of the 6 at-bats that had swinging strikes and home runs ended with batters getting a different pitch than the ones that he swung and missed at. As far as general location goes, we see the same ratio, two of the six got pitches in the same area. Japhet Amador got the same pitch in a similar area and hit it for a homer, but the difference was that the first one was out of the strike zone. O'Brien got the same pitch in the same area against Pete Ruiz, both in the strike zone, and he didn't miss the second one. 

The Peter O'Brien/Dominic Leone at-bat is fascinating because Leone managed to get O'Brien to swing and miss at two different pitches, one out of the zone and one in the zone, and then threw a third separate pitch in the strike zone, in a different part of the strike zone, and it was hit for a homer. Here is a location graph showing the three pitches:

As the first chart shows, the cutter high and in the middle of the strike zone was the ball hit for a homer. The fastball thrown slightly away was missed at, and the slider was low away, not technically in the strike zone, but close. 

Of course, the at-bat actually lasted 8 pitches, so the three pitches above were just a small, though dramatic part, of the battle at the plate. Here are where all 8 pitches were located, labelled with the MLBAM tags of the pitches, along with the amount of strikes there were at the time the pitch was thrown:

Leone threw fastballs early in the count, both away, one high and one low. After getting a strike on O'Brien, Leone threw the slider that got him a whiff to get the count to two strikes. O'Brien then bore down and fouled off four pitches, a slider and cutter away (perhaps both sliders), and a fastball and cutter high and slightly inside. This is when Leone kept the ball over the plate and O'Brien hit it for a homer.

Of course, we want to look at larger sample sizes, and look at more results than just home run at-bats that also contained whiffs. So here we will take a look at strikeout at-bats, breaking them down by what pitches were thrown by the amount of strikes in the count.

Here are all the pitches in Arizona Fall League Pitch F/X games in 2013 that were either called a strike or swung and missed at in at-bats that ended with a strikeout. First, here are the pitches that were thrown with no strikes:

To spoil the two below graphs, while there are some sliders on the fringe here, we are mainly looking at pitches in the zone, with a stronger concentration. Pitchers are using their fastballs to get ahead in counts fro the most part. 

With 1 strike:

Here we see a lot more curves, with some more changes and sliders as well, we also see a lot more pitches off the plate horizontally, especially on the left side. Middle of the plate and high out of the zone seems to have a higher glut of pitches as well. 

With 2 strikes:

There are more pitches everywhere, whether buried in the dirt, extremely high in the zone, or to the left (still not a great glut of pitches to the right, which is where you should throw your pitches to a right-handed hitter, but again, this could be youthful pitchers). There are also more changeups in the zone.

In case the graphs do not show it, here are the average locations in strikeout at-bats, broken down by how many strikes there were at the time the pitch was thrown:


Not surprisingly, when pitchers in the AFL got to two strikes, they tended to throw more breaking balls, which are lower in the zone on average. Surprisingly, there isn't much of a difference in horizontal location.

Wednesday, November 20, 2013

AFL Pitch F/X: Framing/Umpiring

Continuing the look at Pitch F/X data in the Arizona Fall League, I wanted to take a quick glance at one of the most popular subjects in Pitch F/X over the last two or three years, "framing". More specifically, I will look at the strike zone in the AFL, how pitches were called balls and strikes, and give the names of umpires and catchers on some of the more notable calls (I will not have a "framing leaderboard").

First, the following graph shows all the pitches that were called balls in the AFL games tracked by Pitch F/X. I excluded "Ball in the Dirt" tagged pitches because I assumed that they were easily called balls, though you will notice that some of these pitches still didn't make it to the plate.

There is one pitch that really stands out to me on that graph as far as being close to the middle and still called a ball. It was thrown by Will Lamb, a 2nd round pick in 2011 by the Rangers, and was received by Michael Ohlman of the Orioles' organization, who had a big offensive year, but spent most of the year as a DH. The home plate umpire was Jeff Morrow, who will be talked about later. To get a closer look at the pitches called balls, here are the pitches that were called balls in the traditional/simple strike zone:

A couple others stand out here. One was thrown by Mike Nesseth, a Phillies minor leaguer with low walk/strikeout rates, caught by Jake Lowery (Indians, a few 1st base and DH games), and called by Stu Scheurwater, a veteran minor league umpire whom I believe is in AA. Another was thrown by Brewers prospect Taylor Jungmann, caught by Adam Weisenburger, also of the Brewers, and called by Seth Buckminster.

By contrast, here are the pitches that were called strikes in the Pitch F/X games in the AFL:

We see typical lefty strike syndrome here, but I wanted to look at the pitches furthest from the strike zone on each corner, that is, the highest pitch called a strike, the pitch furthest to the left called a strike, etc.

The furthest one to right side of the zone (catcher's perspective), isn't that bad, thrown by Bo Schultz, caught by Dustin Garneau, and called by Marcus Pattillo:

Schultz is a 28 year old Diamondback minor leaguer who pitched in AA and AAA in 2013. While he showed some strikeout potential, he walked too many batters, especially for an older pitcher.

Garneau is a 26 year old that has reached AA for the Rockies. He hasn't been notable (either bad or good) with the bat, and despite a good CS %, seems to have a lot of passed balls. 2013 was the first year that he played anything other than catcher, playing 13 games at DH and 2 at first base.

Pattillo is a AA umpire in the Southern League, and umpired in the Venezuelan Winter League last season.

The furthest to the left is further outside, thrown by Noe Ramirez, caught by Jorge Alfaro, and called by Jeff Morrow:

Ramirez is a 23 year old Red Sox prospect that had good strikeout to walk rates in A+ and AA in 2013.

Alfaro is a 20 year old that is considered by some to be a top 100 prospect in baseball. The Rangers' affiliate has reached A+ and has been okay with the bat. 2013 contained a lot of passed balls and he played some first base and DH.

Morrow is a AAA umpire in the Pacific Coast League.

The highest pitch called a strike was thrown by Omar Duran, caught by Adrian Nieto, and called by Gabe Morales:

Duran is a 23 year old Athletics minor leaguer that spent most of the year in A+. While he struck out a lot of batters, he was also very wild.

Nieto is a 24 year old Nationals prospect that played all of 2013 in A+. He played 24 games at DH this season, but has yet to show any power.

Morales is a AAA umpire in the International League

The lowest pitch called for a strike was thrown by Anthony Ferrera, caught by Derrick Chung, and called by Seth Buckminister

Ferrera struggled with walks in 2013 with the Cardinals' AA affiliate.

Chung is a 25 year old with the Blue Jays that played in A+ in 2013. He has struggled with the bat and has played all over the diamond, including 22 games at 2nd base.

Buckminister is a AAA umpire in the International League. He umpired some spring training games in 2013 and famously broke his hand in one of the games.

I mentioned Jeff Morrow the umpire above in two separate games, so I thought it would be interesting to look at the two games as a whole and see how he did overall, and whether he has a quirky strikezone, or if his missed calls were just missed.

First, let's look at his October 11th games, starting with the called balls.


Other than the obvious one, it seems that there are pitches on every corner that could have been called strikes that Morrow elected to call balls. 

Here are his called strikes from that game:

You will notice, that is just the strike zone, nothing was called a strike that was out of the strike zone. So perhaps he just has a small zone. However, he did call that Ramirez pitch that was way out of the zone a strike on the 28th. To get more data, let's look at his game on the 28th, starting with the pitches he called a ball:

Here, it isn't every corner like the last game, but there appear to be at least 5 pitches on the right side of the strike zone that should have probably been called strikes, assuming that they were measured correctly by Pitch F/X.

Here are his called strikes:

Here, we see that his zone is small when it comes to top to bottom and even to the right, but he gave up a lot of the edge in what is normally the lefty strike zone, something he didn't do on the 11th.

Overall, I think Morrow seemed to fit in the general mold of the AFL home plate umpiring. He would give pitchers some room on the left, but for the most part, was more likely to call a pitch in the zone a ball than call a pitch outside of the zone a strike. This small zone may be why their were 4.17 walks per every 9 innings in the AFL, over half a walk per 9 innings over both AAA leagues in 2013.

Sunday, November 17, 2013

2013 AFL Pitch F/X Data: Velocity

In the previous post, I look at the locations of pitches in the Arizona Fall League. In this one, I wanted to continue to look at the data of the 110 pitchers by focusing on velocity. First, here is a graph that breaks down both the pitch selection (by percentage) and average velocity of all pitch types thrown in the Pitch F/X games in the Arizona Fall League:

For comparison, here is the MLB averages according to FanGraphs in 2013:


There were no knuckleballs, knucklecurves, screwballs, eephus, or forkballs thrown in the AFL according to the MLBAM tags. FanGraphs has also kept the old fastball label (FA) instead of moving to the FF. The FAs in the AFL are most likely errors.

While changeups are very slightly slower in the AFL (.03 MPH), they were actually used more frequently in the AFL, which I found surprisingly. Curves were thrown at the same velocity, but less frequently in the AFL, and there were less cutters and sliders as well. It appears that there was a higher volume of four seam fastballs, though they were thrown at half a MPH slower.

What about individual pitchers? Who were some of the hardest throwers in the AFL? Here are the fastest 50 pitches in the AFL tracked by Pitch F/X in 2013:

The fastest 27 pitches were either thrown by Keone Kela or Ken Giles. Giles was a 7th round draft pick in 2011 by the Phillies, and the right-hander has been almost exclusively a reliever in his minor league career and he hasn't yet reached AA. He has struggled with walks, but has put up gaudy strikeout numbers. Kela has been profiled on the blog before, but his 2013 season only contained 39 innings over three different levels (though his strikeout rate was great). Juan Jaime had the only two pitches out of the top 39 fastballs not thrown by Kela or Giles. Jaime is already 26, and the Braves' right-hander has struggled to put a full season together, just making AA in 2013. He had high walk and strikeout numbers.

How about the slowest 50 pitches in the AFL?


Kevin Vance and his slow curve had a good year in AA for the White Sox out of the bullpen, and he has racked up plenty of strikeouts. Mike Morin also had several of the slowest pitches in the AFL, and he is coming off of a great year in the Angels system with an ERA under two and reaching AA.

Of course, we haven't looked at individual pitch types yet, so broken down by pitch type, MLBAM tags, here are the fastest individual pitches per each type:


Lendy Castillo reached the Majors with the Cubs in 2012, but struggled. In 2013, he actually spent most of the year in the lower minors and struggled there as well. Adys Portillo doesn't turn 22 until December, but is coming off a lost year with just 3 appearances (just starts) in A-ball. Shawn Armstrong, an 18th round pick by the Indians, had a tremendous year in 2012, but spending most of 2013 in AA, had a very mediocre year by ERA because of walks, but he continued to strikeout batters. Matt Heidenreich was acquired by the Astros in the Brett Myers trade, but had a horrendous 2013. Alex Meyer is one of the top pitching prospects in baseball, but had a shortened year in AA.

The slowest pitches by each type:

I think there are some Pitch F/X errors here, and it seems to have mistreated Miguel Pena of the Red Sox. However, scouting reports have described him as a pitchability guy with a fastball mainly in the 80s, so perhaps these low readings aren't unbelievable.

While we haven't looked at results or hitters yet (I plan on taking a deeper look later), I thought it would be interesting to see whether or not there was a correlation between faster fastballs and success in the AFL, like we see in basically every level of play.

Not surprisingly, the harder the fastball, the more likely it is to be a whiff, and the softer, the more likely it turns into a run scoring play (though the out versus no out distinction is fuzzy at best).

What about pitches on the whole, regardless of classification? One would expect that younger hitters would struggle with slower pitches, fooled by breaking balls, and hitting fastballs better. It turns out, this is the case for the most part:

Batted ball results don't make as much sense as they do with the fastballs, but the pattern is clear. Batters were more likely to hit faster pitches, or at least, fastballs over breaking balls and offspeed pitches.

Friday, November 8, 2013

2013 MLB Release Point Leaderboards

Before the 2013 season, I created release point leaderboards using Pitch F/X data, something that is not really out there anywhere else. A search suggests that this blog is still the only one that has them. In this post, I am updating and revamping the leaderboards. In the old post, I used Brooks Baseball's data, which is done using a 55 feet release point instead of the Pitch F/X standard of 50. This means that you have to use Brooks' data to compare release points of new pitchers to old pitchers. For this post, I am using the traditional 50 feet release point, just for easier comparisons. Also, in the older post, I only looked at fastballs. While I don't think it will change a lot (most pitchers have fairly uniform release points for all their pitches), this leaderboard will be all pitches thrown. Also, this leaderboard will only look at the 2013 season and won't differentiate between starters and relievers.

So below should be the average release points for every pitcher that pitched in 2013. First there are a few things that should be pointed out. I tried to take all position players out, so it should be all regular pitchers. However, because I did it by team using Baseball Savant, if a pitcher pitched for multiple teams in 2013, their name will appear multiple times. I also included a sheet of each team's average vertical release point as a whole, just because I found it interesting. The overall graph is going to be messy (and may not load easily, for me, it works a lot better in the Google Chrome family of browsers than Firefox) just because of all the names. I suggest following the link to get a better (and more interactive) look at the graph, but the main point is not the graph, which is just a visual aid, but instead the first sheet, the one with the list of names.

Sunday, November 3, 2013

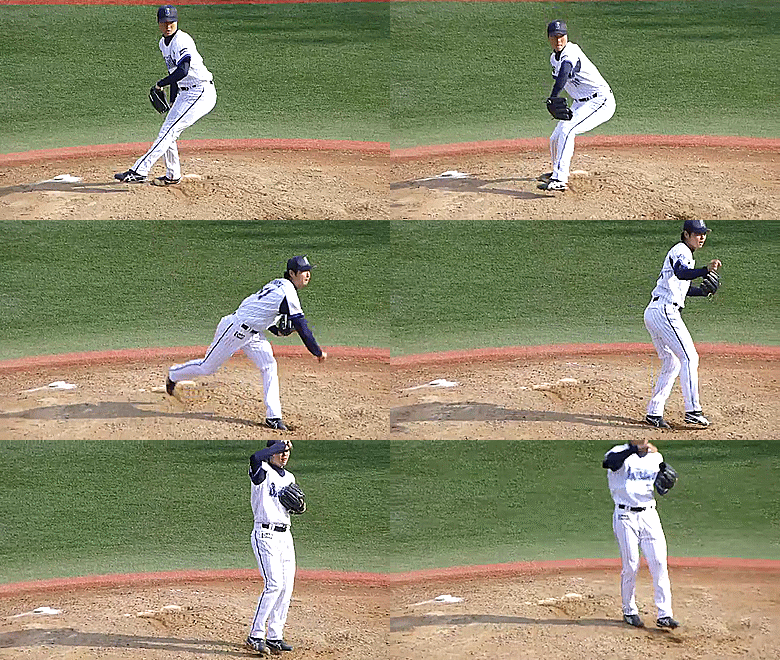
Yokohama DeNA Baystars Pitcher Deliveries

By almost every simple metric, the Yokohama DeNA Baystars had the worst pitching staff in the Central League. This is why, despite having the best offense in the league by runs scored, the Baystars finished 15 games under .500. They still weren't without some good pitching performances, such as Jorge Sosa's dominance in relief, Shugo Fujii's weird year (leading the team's starters in ERA despite just 3 more strikeouts than walks), and another year of Daisuke Miura. I wrote about a scouting report on Miura here, so his delivery is not including in the GIFs below.

Shugo Fujii

Shun Yamaguchi

Hiroshi Kobayashi

Teruaki Yoshikawa

Futoshi Kobayashi


 Shoichi Ino


Shigeru Kaga

Kazuki Mishima


Hitoshi Fujie

Kota Suda

 Kisho Kagami


 Kentaro Takasaki
Masanori Hayashi

Yujo Kitagata

Kazumasa Kikuchi

 Takayuki Shinohara


 Shigeki Ushida

Yasushi Kamiuchi

Shinji Ohara

Tateki Abe

Kenji Tsuchiya

Kenjiro Tanaka

Takayuki Makka

Taketora Anzai

Takehiro Fukuda


 Jorge Sosa

Yota Kosugi


 Tim Corcoran

Atori Ota

Shoma Sato

Enyelbert Soto

Kai-Wen Cheng

Shuichiro Osada


Yuki Kuniyoshi


 I-Cheng Wang


 Takuro Ito


 Kosuke Tomita